
This article explains how to use remote debugging to inspect and code running in the new Windows 8 ("Metro-style") Firefox app, using the developer tools in Firefox on the desktop.
Prerequisites
You will need:
- Windows 8 (Metro-style) Firefox running in the touch-friendly "Metro" mode on a Windows 8 computer.
- Firefox running in classic "desktop" mode on Windows, Mac OS X, or Linux, either on a separate computer or in a separate profile on the same computer.
Set up Firefox for Metro
Go to about:config in Firefox for Metro, and set the following required preference:
devtools.debugger.remote-enabled = true
You may also want to set these optional preferences:
devtools.debugger.force-local = false(if you want to connect from a different machine over the network)devtools.debugger.remote-host(to change the TCP hostname where Firefox will listen for connections)devtools.debugger.remote-port(to change the TCP port number where Firefox will listen for connections)devtools.debugger.prompt-connection = false(Allow connections without displaying a confirmation prompt. This can be a security risk, especially if you also set theforce-localpreference tofalse.)
Set up Firefox for desktop
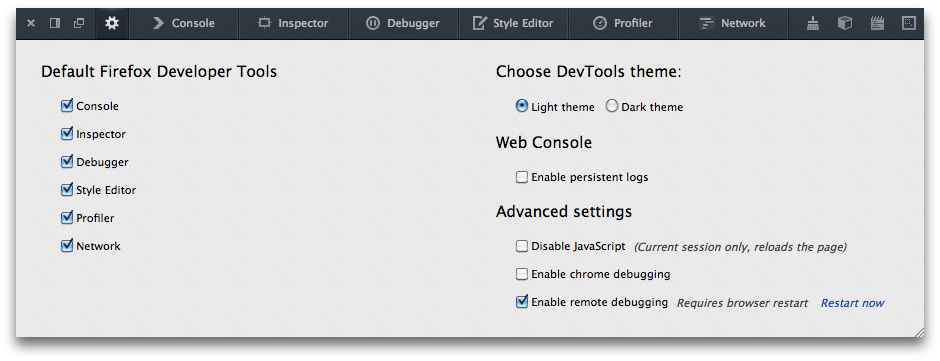
On the desktop, remote debugging is enabled by a setting in the Toolbox. Open the Toolbox, click the "Settings" button in the toolbar, and check "Enable remote debugging" in the Settings tab. If you're using a version of Firefox older than 27, you'll need to restart the browser for the setting to take effect.
Connecting
On the desktop
On the desktop, open the Web Developer menu and select "Connect...". You'll see a page that looks like this:
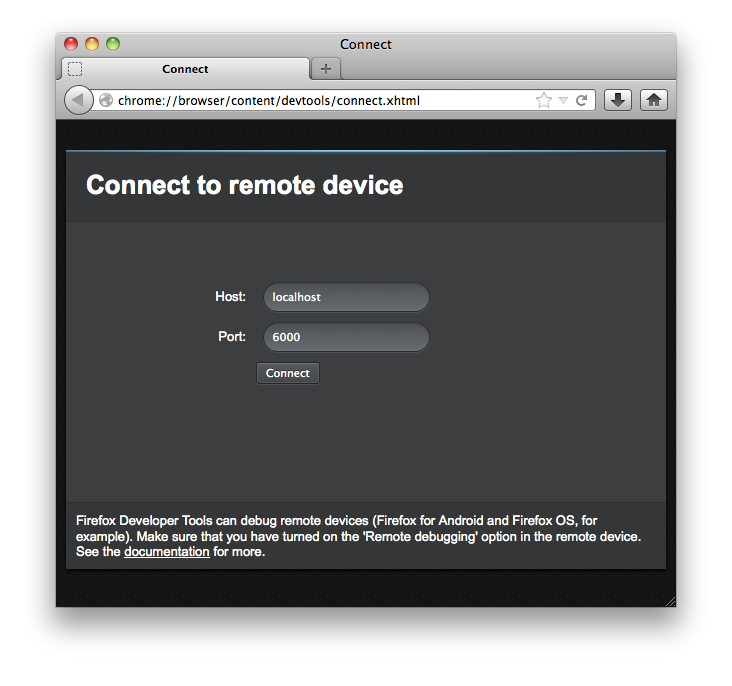
If you are running Firefox for Metro on the same computer with the default settings, use the default host (localhost) and port (6000), and press the "Connect" button.
If you are connecting to Firefox for Metro on a different computer or a different port, enter the appropriate hostname and port number and then press "Connect."
In the Windows 8 (Metro) browser
Next you'll see a dialog in Firefox for Metro asking you to confirm the connection. Press the "OK" button to continue.
Tip: If the remote connection times out, flip to the desktop via the desktop tile and check if Windows Firewall has thrown up an incoming connection permissions prompt.
On the desktop
Next, the desktop shows you a dialog that looks something like this:
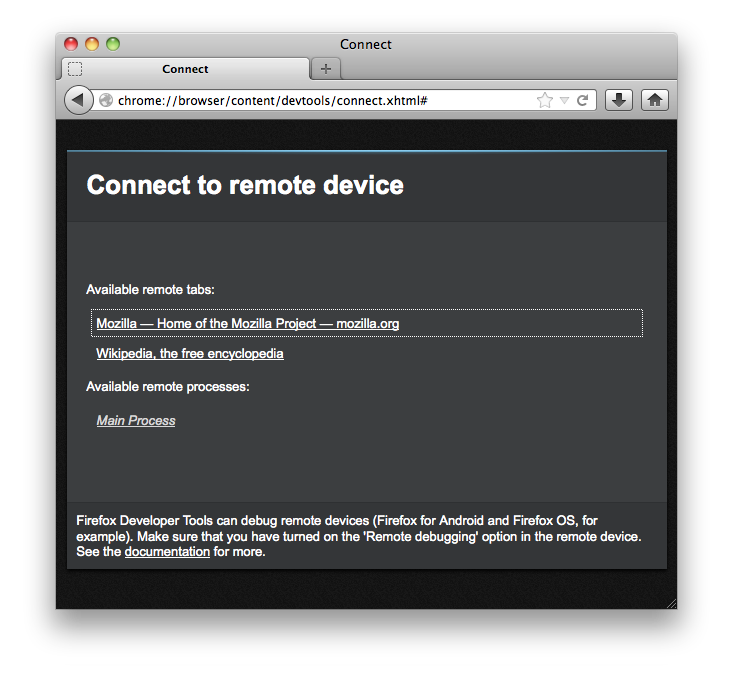
This is asking whether you want to debug web content running in a browser tab, or to debug the browser code itself.
- You'll see one entry under "Available remote tabs" for each open tab, and clicking it will attach the debugging tools to the web content hosted by that tab. If you want to debug your web content, you'll choose the relevant content tab.
- You'll see one entry under "Available remote processes": this is the browser process itself. You'll choose this option if you want to debug the browser's own code.
Let's choose to attach to the mozilla.org website. The Toolbox will open in its own window, attached to the Firefox for Metro tab that's currently hosting mozilla.org:
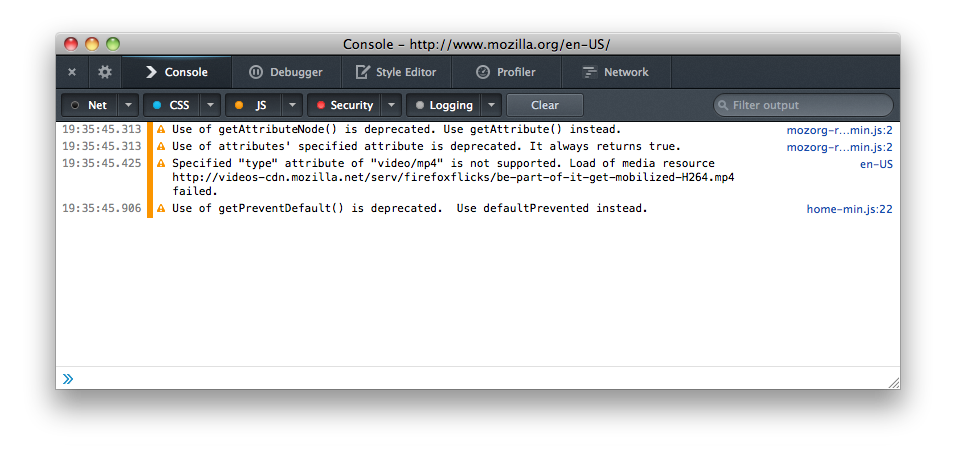
The Toolbox, and the tools it hosts (including the Console, Debugger, Style Editor, Profiler, etc.), work in just the same way as they do when attached to local content.