
This document explains how to debug Mozilla-derived applications such as Firefox, Thunderbird, and SeaMonkey on Windows using the Visual C++ IDE.
If VC++ and your Mozilla application hang shortly after you launch the application under the debugger, see Problems Loading Debug Symbols.
Ways to start the debugger
First of all, it's necessary to install a Visual Studio extension to be able to follow child processes as they are created. Firefox, in general, and even in non-e10s mode, does not start the main process directly, it starts it via a Launcher Process. This means that Visual Studio will only attach to the first process it finds, and will not hit any break-point (and even notifies you that it cannot find their location). Microsoft Child Process Debugging Power Tool allows automatically attaching to child processes, such as Web Content process, GPU process, etc. Enable it by going its configuration menu in "Debug > Other debugging targets > Child process debugging settings", and ticking the box.
If you have followed the steps in Building Firefox for Windows and have a local debug build, you can execute ./mach run --debug from the same command line. It would open Visual Studio with Firefox's run options configured. You can click "Start" button to run Firefox then, already attached in the debugger.
Alternatively, if you have generated the Visual Studio solution, via ./mach build-backend -b VisualStudio, opening this solution allows you to run firefox.exe directly in the debugger. Making it the startup project, by right clicking on it (it appears bold when it's the case) can be useful. Breakpoints are kept across runs, this can be a good way to debug startup issues.
Run the program until you hit an assertion. You will get a dialog box asking if you would like to debug. Hit "Cancel". The MSDEV IDE will launch and load the file where the assertion happened. This will also create a Visual C++ Mozilla project in the directory of the executable by default.
Attach the debugger to an existing Mozilla process. In the Visual Studio, select Debug > Attach to Process. If you want to debug a content process, you can hover on the tab of page you want to debug, which would show the pid. You can then select the process from dialog opened from "Attach to Process". For more information, see Attach to Running Processes with the Visual Studio Debugger.
Debugging Release and Nightly Builds
Refer to the steps to use the Mozilla symbol server and source server.
Creating a Visual C++ project for Firefox
Please refer to the documentation on firefox-source-docs.
Changing/setting the executable to debug
VC++ 6.0: To change or set the executable to debug, go to Project > Settings..., Debug tab and select General from the drop down list. "Executable for debug session:" should show the executable you are debugging. If it is empty or incorrect, use the arrow button and select Browse... to locate the executable.
Command line parameters and environment variables
VC++ 6.0: To change or set the command line options, go to Project > Settings..., Debug tab and select General from the drop down list. "Program arguments:" should show the options.
Some common options would be the URL of the file you want the browser to open as soon as it starts, starting the Profile Manager, or selecting a profile. You can also redirect the console output to a file (by adding "> filename.txt" for example, without the quotes).
In VC 7 and 8 this option is called Project > Properties > Debugging > Command Arguments. VC 8 also allows you to set environment variables there.
Setting breakpoints in DLLs which are not yet loaded in memory
VC++ 6.0: Go to Project > Settings..., Debug tab and select "Additional DLLs" from the drop down list. Check "Locate Additional DLLs" option. For each DLL, click the "New" button which creates a new entry and then hit the "..." buttons which lets you browse to the DLL. You will only be able to add one DLL at a time.
VC++ 7.0 automatically finds additional DLLs.
Customizing the debugger's variable value view
You can customize how Visual C++ displays classes in the variable view. By default VC++ displays "{...}" and you need to click the small + icon to expand the members. You can change this behaviour, and make Visual C++ display whatever data member you want in whatever order, formatter however you like instead of just "{...}".
You need to locate a file called "AUTOEXP.DAT" in your Visual C++ installation. By default it will be:
VC++ 6.0:
C:\Program Files\Microsoft Visual Studio\Common\MSDev98\Bin\AUTOEXP.DAT
VC++ 7.0:
C:\Program Files\Microsoft Visual Studio .NET 2003\Common7\Packages\Debugger\AUTOEXP.DAT
The file has information about the format in the beginning, and after a little practice you should be well on your way. Here are some entries that will make your life easier:
;; Mozilla (1.7beta and later)
nsAutoString=<mData,su>
nsString=<mData,su>
nsCString=<mData,s>
nsCAutoString=<mData,s>
nsRect=x=<x,d> y=<y,d> width=<width,d>; height=<height,d>
nsStaticAtomWrapper=<mStaticAtom->mString,s>
nsIAtom=<mString,su>
; the following are not necessary in vc8
nsCOMPtr<*>=<mRawPtr,x>
nsRefPtr=<mRawPtr,x>
nsAutoPtr=<mRawPtr,x>
After you have made the changes and saved the file, you will need to restart Visual C++ for the changes to take effect.
For XPCOM Strings (the "external" string API) you can use the following values:
;; Mozilla (1.9)
; Internal Strings
nsAString_internal=<mData,su>, length=<mLength,u>
nsACString_internal=<mData,s>, length=<mLength,u>
; XPCOM Strings
nsAString=<nsStringContainer.v,su>, length=<nsStringContainer.d1,u>
nsACString=<nsCStringContainer.v,s>, length=<nsCStringContainer.d1,u>
nsStringContainer=<v,su>, length=<d1,u>
nsCStringContainer=<v,s>, length=<d1,u>
There is a more extensive version of this file in progress in AutoExpForVC8.
Avoiding stepping into certain functions
You can avoid stepping into certain functions, such as nsCOMPtr methods, using an undocumented feature of VC. See the blog post How to Not Step Into Functions using the Visual C++ Debugger for details.
Here are some wildcards you can use (tested with VC 8):
nsCOMPtr.*\:\:.*=NoStepInto
(nsG|g)etter_*AddRefs.*=NoStepInto
NS_ConvertUTF.*
; Might be too broad:
(ns|Promise)[^\:]*[sS]tring.*
...add common functions to this list
should probably make a .reg file for easy importing
Obtaining stdout and other FILE handles
Running the following command in the Command Window in Visual Studio returns the value of stdout, which can be used with various debugging methods (such as nsGenericElement::List) that take a FILE* param:
Debug.EvaluateStatement {,,msvcr80d}(&__iob_func()[1])
(Alternatively you can evaluate {,,msvcr80d}(&__iob_func()[1]) in the QuickWatch window)
Similarly, you can open a file on the disk using fopen:
>Debug.EvaluateStatement {,,msvcr80d}fopen("c:\\123", "w")
0x10311dc0 { ..snip.. }
>Debug.EvaluateStatement ((nsGenericElement*)0x03f0e710)->List((FILE*)0x10311dc0, 1)
<void>
>Debug.EvaluateStatement {,,msvcr80d}fclose((FILE*)0x10311dc0)
0x00000000
Note that you may not see the debugging output until you flush or close the file handle.
Disabling ASSERTIONS
There are basically two ways to disable assertions. One requires setting an environment variable, while the other affects only the currently running program instance in memory.
Environment variable
There is an environment variable that can disable breaking for assertions. This is how you would normally set it:
set XPCOM_DEBUG_BREAK=warn
The environment variable takes also other values besides warn, see XPCOM_DEBUG_BREAK for more details.
Note that unlike Unix, the default for Windows is not warn, it's to pop up a dialog. To set the environment variable for Visual Studio, use Project > Properties > Debugging > Environment and click the little box. Then use
XPCOM_DEBUG_BREAK=warn
Changing running code
You normally shouldn't need to do this (just quit the application, set the environment variable described above, and run it again). And this can be dangerous (like trashing your hard disc and corrupting your system). So unless you feel comfortable with this, don't do it. You have been warned!
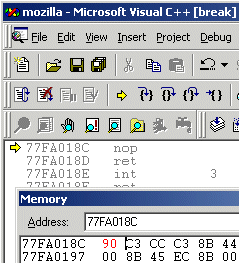
It is possible to change the interrupt code in memory (which causes you to break into debugger) to be a NOP (no operation).
You do this by running the program in the debugger until you hit an assertion. You should see some assembly code. One assemly code instruction reads "int 3". Check the memory address for that line. Now open memory view. Type/copy/drag the memory address of "int 3" into the memory view to get it to update on that part of the memory. Change the value of the memory to "90", close the memory view and hit "F5" to continue.
Confused? See the screenshot below:
VC++ 7.0?
Automatically handling ASSERTIONS without a debugger attached
When an assertion happens and there is not a debugger attached, a small helper application (windbgdlg.exe) is run. That application can automatically select a response to the "Do you want to debug" dialog instead of prompting if you configure it, for more info, see windbgdlg.exe.
Debugging optimized builds
To effectively debug optimized builds, you should enable debugging information which effectively leaves the debug symbols in optimized code so you can still set breakpoints etc. Because the code is optimized, stepping through the code may occasionally provide small surpises when the debugger jumps over something.
You need to make sure this configure parameter is set:
--enable-debugger-info-modules=yes
You can also choose to include or exclude specific modules. This is particularly useful to avoid linking layout with debugging information.
Console debugging
When printing to STDOUT from a content process, the console message will not appear on Windows. One way to view it is simply to disable e10s (./mach run --disable-e10s) but in order to debug with e10s enabled one can run
./mach run ... 2>&1 | tee
It may also be necessary to disable the content sandbox (MOZ_DISABLE_CONTENT_SANDBOX=1 ./mach run ...).
Running two instances of Mozilla simultaneously
You can run two instances of Mozilla (e.g. debug and optimized) simultaneously by setting the environment variable MOZ_NO_REMOTE:
set MOZ_NO_REMOTE=1
Or, starting with Firefox 2 and other Gecko 1.8.1-based applications, you can use the -no-remote command-line switch instead (implemented in bug 325509).
You can also specify the profile to use with the -P profile_name command-line argument.
Debugging JavaScript
Use Venkman, the JavaScript Debugger for Mozilla.
You can use helper functions from nsXPConnect.cpp to inspect and modify the state of JavaScript code from the MSVS debugger.
For example, to print curent JavaScript stack to stdout, evaluate this in QuickWatch window:
{,,xul}DumpJSStack()
Note: Visual C++ will show you something in the quick watch window, but not the stack, you have to look in the OS console for the output.
Also this magical command only works when the VC++ stack is in certain states. It works when you have js_Interpret() in the newest stackframe
Debugging minidumps
See debugging a minidump.
Debugging tinderbox builds
See Running Windows Debug Builds
Problems Loading Debug Symbols
If both your application and Visual C++ hang shortly after launching the application under the debugger, you may be hitting a known deadlock in the way Visual Studio downloads debug symbols for the system libraries; see https://connect.microsoft.com/VisualStudio/feedback/details/422970/hang-loading-rasapi32-pdb-when-using-symbol-server.
There are two ways to work around this problem:
- Turn off automatic symbol downloading for system libraries: in Tools > Options > Debugging > Symbols, uncheck the Microsoft symbol server.
- Pre-load all the Windows debug symbols. These instructions apply to Visual Studio 10 on Windows 7; other software versions likely need to have file paths adjusted.
- Locate the Microsoft utility "SymChk.exe" on your system (it will likely be in the installation directory of your Windows Debugging Tools).
- Find the directory where Visual Studio caches downloaded symbols; in VC++ 10 open the menu to Tools > Options > Debugging > Symbols and copy the field "Cache symbols in this directory".
- In a command window, run
symchk.exe /r C:\windows\SysWOW64\ /s "SRV*<your cache symbols directory>\MicrosoftPublicSymbols*http://msdl.microsoft.com/download/symbols"
Note the "\MicrosoftPublicSymbols" appended to the cache directory configured in Visual Studio.
Downloading all symbols can take a long time; you can replace C:\windows\SysWOW64\ with the name of a single .DLL to download symbols only for the specific libraries you are trying to debug. Unfortunately, it's hard to know which symbols to download without having VS hang and seeing the "Downloading symbols for <library>" status at the bottom left of the main window.
Problems post-mortem debugging on Windows 7 SP1 x64?
If you attempt to use NS_DebugBreak etc to perform post-mortem debugging on a 64bit Windows 7, but as soon as you try and continue debugging the program crashes with an Access Violation, you may be hitting a Windows bug relating to AVX support. For more details, including a work-around see this blog post or this social.msdn thread. (And just in-case those links die, the work-around is to execute
bcdedit /set xsavedisable 1
from an elevated command-prompt to disable AVX support.)
Got a tip?
If you think you know a cool Mozilla debugging trick, feel free to discuss it with #developers and then post it here.
Originally by Heikki Toivonen.