
Intel Power Gadget provides real-time graphs of various power-related measures and estimates, all taken from the Intel RAPL MSRs. This article provides a basic introduction.
Note: The power profiling overview is worth reading at this point if you haven't already. It may make parts of this document easier to understand.
The main strengths of this tool are (a) it works on Windows, unlike most other power-related tools, and (b) it shows this data in graph form, which is occasionally useful. On Mac and Linux, tools/power/rapl is probably a better tool to use.
Understanding the Power Gadget output
The following screenshot (from the Mac version) demonstrates the available measurements.
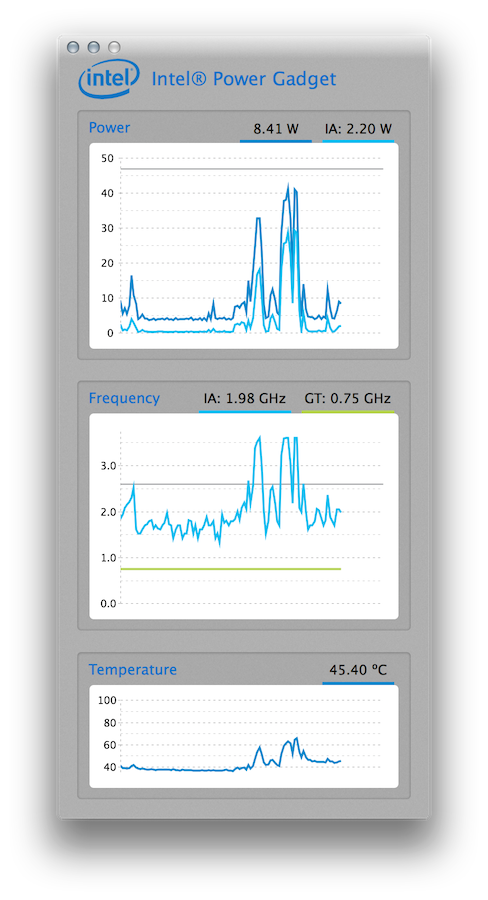
The three panes display the following information:
- Power: Shows power estimates for the package and the cores ("IA"). These are reasonably useful for power profiling purposes, but Mozilla's
raplutility provides these along with GPU and RAM estimates, and in a command-line format that is often easier to use. - Frequency: Shows operating frequency measurements for the cores ("IA") and the GPU ("GT"). These measurements aren't particularly useful for power profiling purposes.
- Temperature: Shows the package temperature. This is interesting, but again not useful for power profiling purposes. Specificially, the temperature is a proxy measurement that is affected by processor power consumption, rather than one that affects it, which makes it even less useful than most proxy measurements.
Intel Power Gadget can also log these results to a file. This feature has been used in energia, Roberto Vitillo's tool for systematically measuring differential power usage between different browsers. (An energia dashboard can be seen here; please note that the data has not been updated since early 2014.)
Version 3.0 (available on Mac and Windows, but not on Linux) also exposes an API from which the same measurements can be extracted programmatically. At one point the Gecko Profiler used this API on Windows to implement experimental package power estimates. Unfortunately, the Gecko profiler takes 1000 samples per second on desktop and is CPU intensive and so is likely to skew the RAPL estimates significantly, so the API integration was removed. The API is otherwise unlikely to be of interest to Mozilla developers.