Open the Performance tools
To open the Performance tools:
- press Shift + F5
- select "Performance" from the Web Developer submenu in the Firefox Menu (or Tools menu if you display the menu bar or are on OS X)
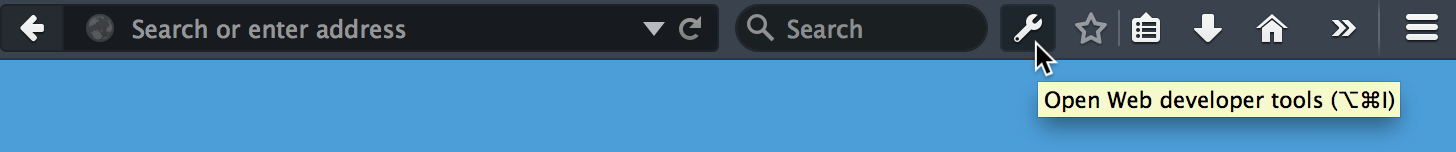
- select "Performance" from Tools button, in the Toolbar, if you have one:
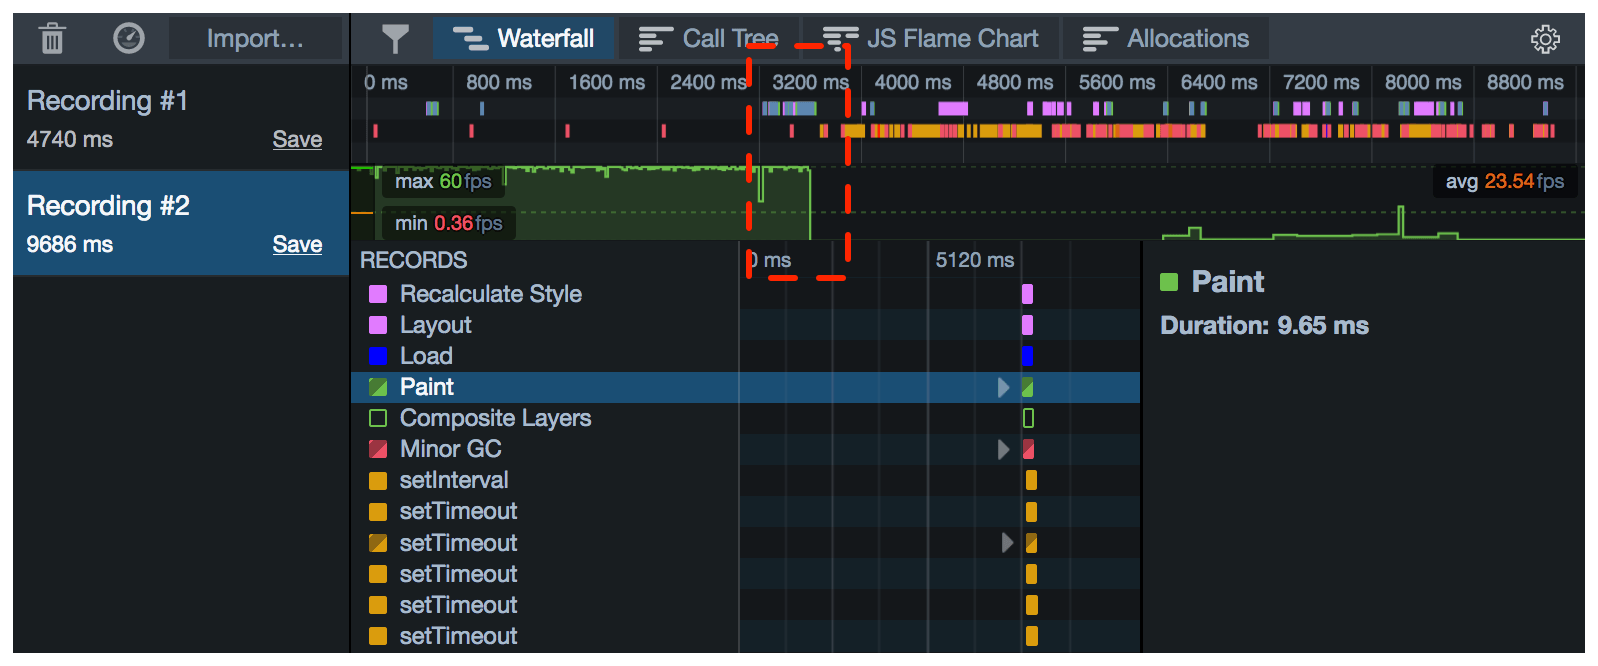
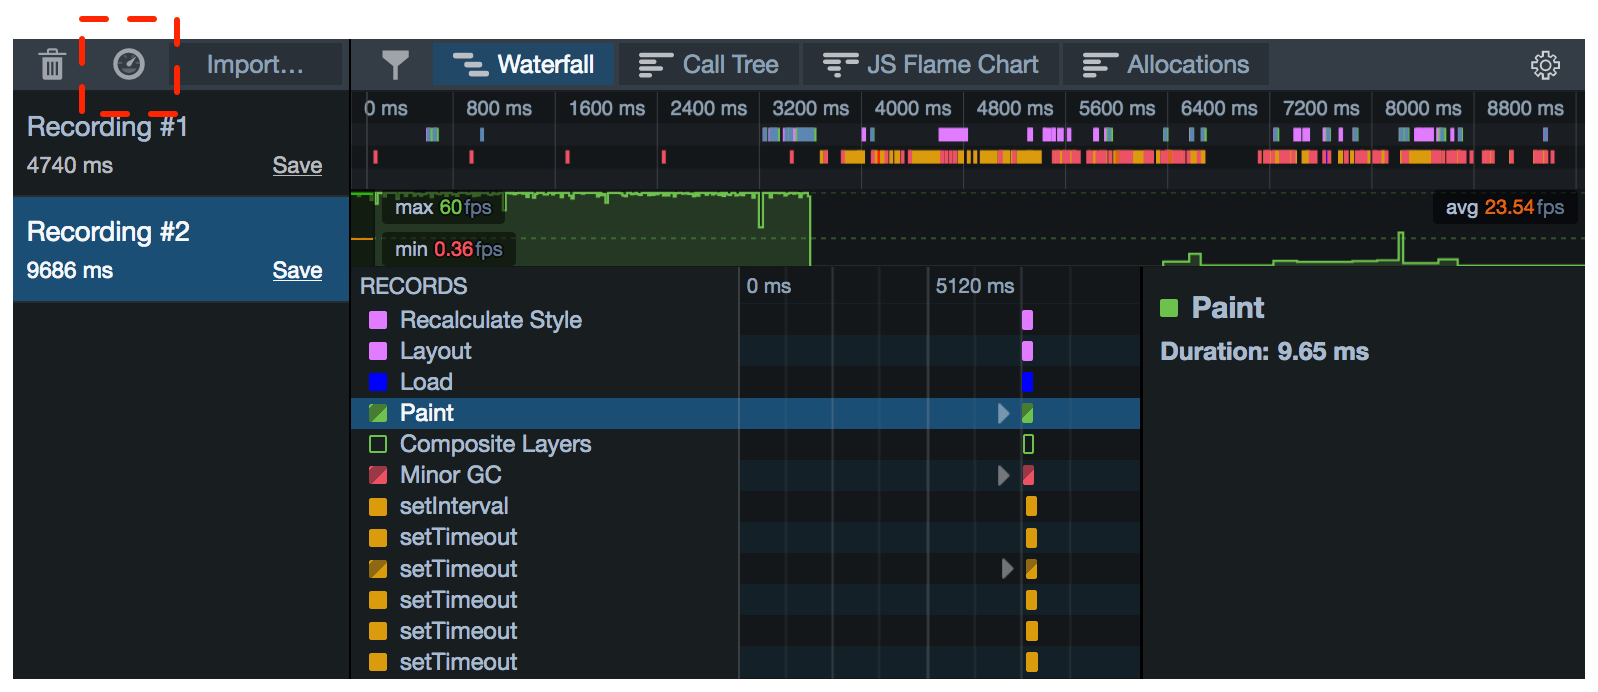
Record a profile
To start a new recording, press the stopwatch icon in the Recordings pane. To stop, press it again:
You can also start and stop recording from the Web Console, using console.profile() and console.profileEnd().
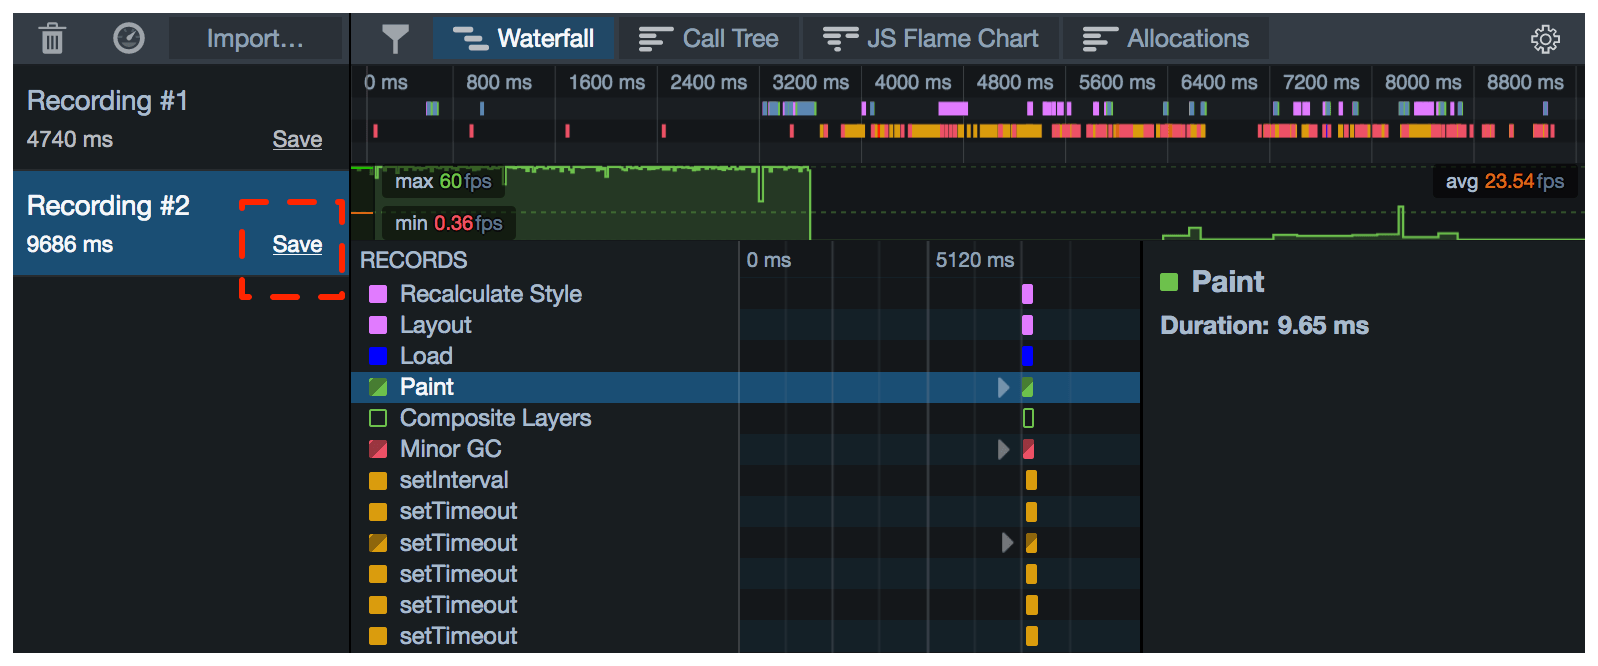
Save a profile
To save a profile, click the link labeled "Save" in the Recordings pane:
Load a profile
To load a profile, click "Import..." and choose the file:

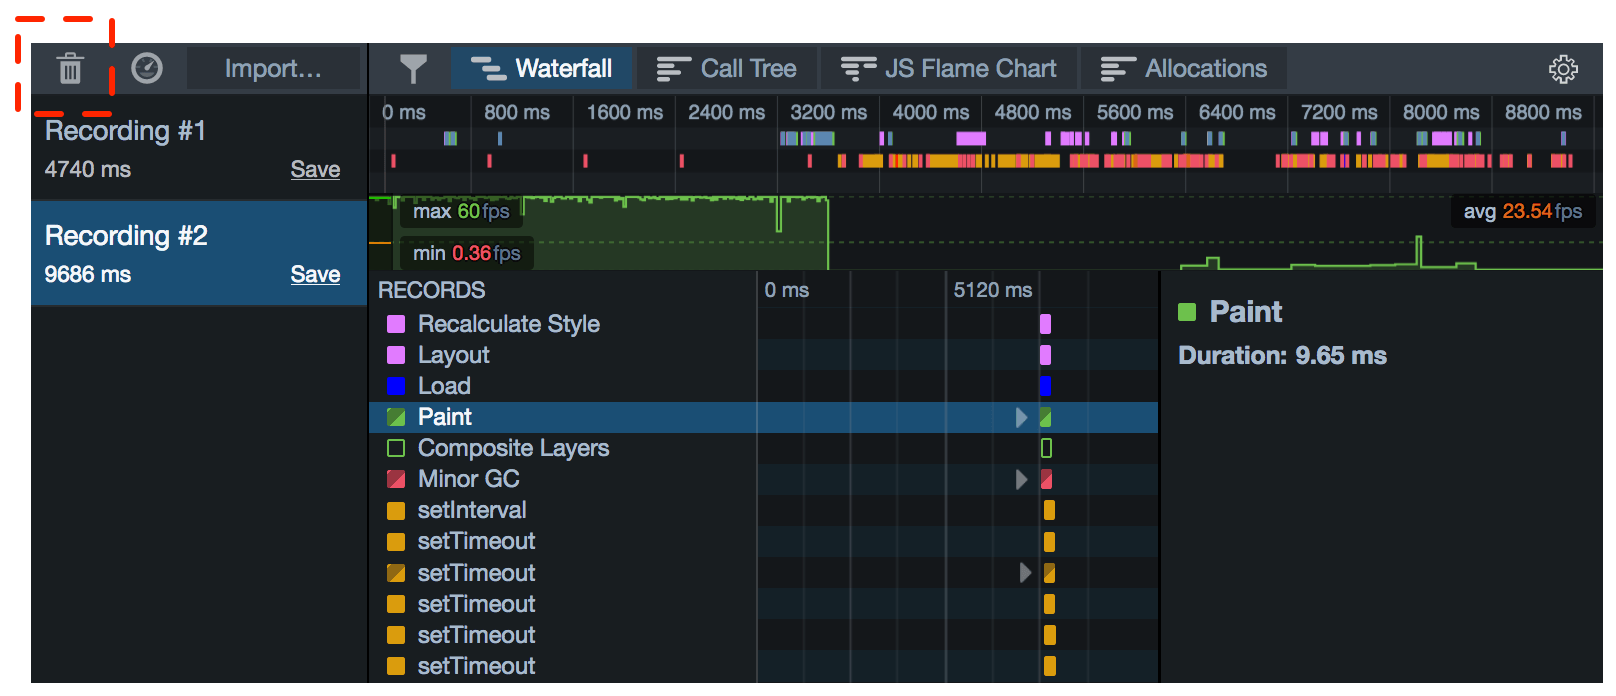
Clear all loaded profiles
To clear all loaded profiles, click "Clear".
If you do this, you'll lose any loaded profiles that you have not saved.
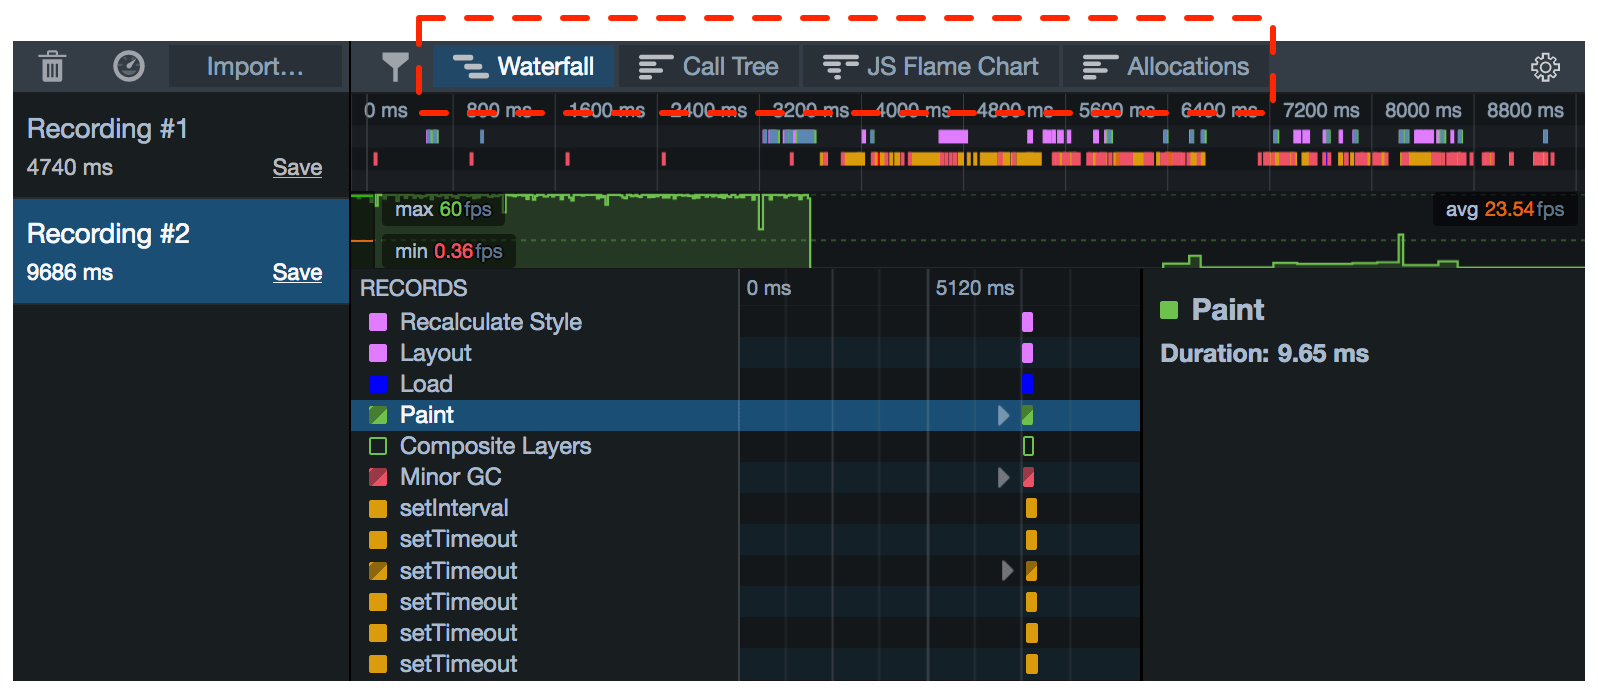
Select a tool
To switch between the Waterfall, Call Tree, and Flame Chart tools, use the buttons in the toolbar:
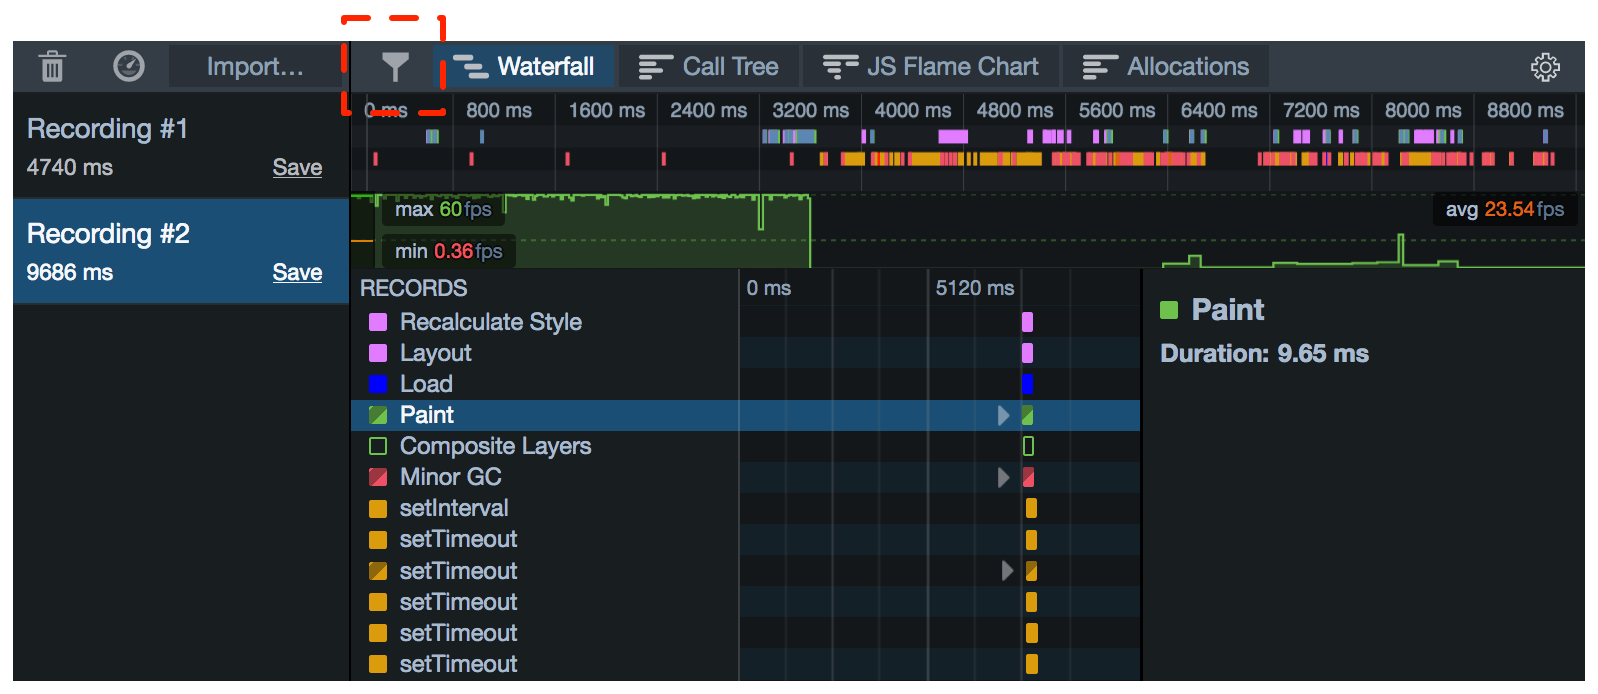
Configure markers displayed
To control which markers are shown in the Waterfall, use the button in the toolbar:
Zoom in
To zoom into a slice of the recording, select that slice in the recording overview: