
Firefox Developer Tools now has a built-in memory profiler. This article details how to use an old profiler specifically designed for Firefox OS devices.
Getting the Profiler Add-on
The built-in memory profiler's interface is still under construction. It can be obtained by installing the Memory Profiler Add-on. You may need to set the "xpinstall.signatures.required" pref to false in order to install it, since the XPI is not yet signed.
Using the Add-on
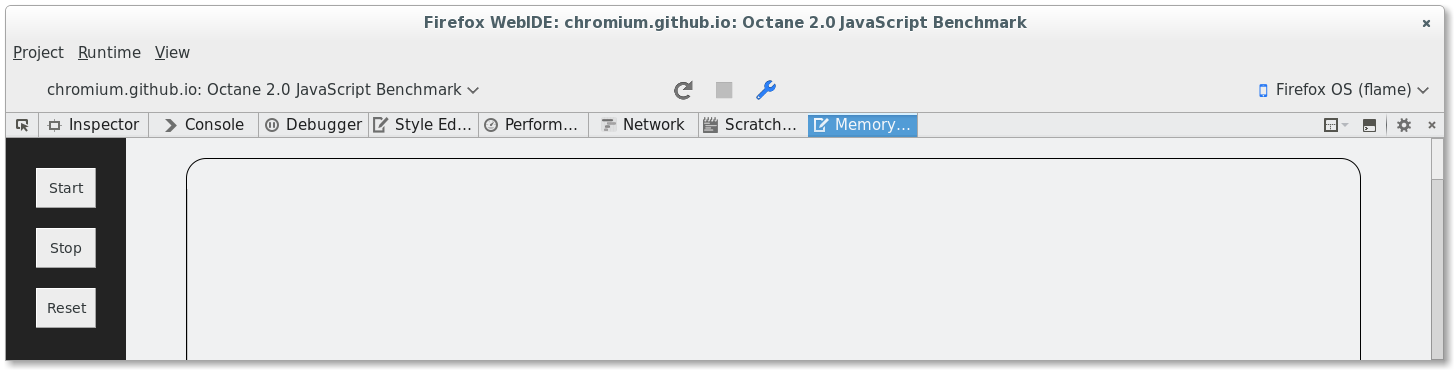
Open the devtools panel or WebIDE. Select the MemoryProfiler tab. To take a profile you can use the buttons in the profiler panel.
- Start - start profiling
- Stop - stop profiling
- Reset - clear profile data when profiler is stopped
Profile data is accumulated and resumed after start. Use reset to start a new recording.
Understanding the Profiles
Traditional memory analysis tools look at the data. They build the referring-to, namely retaining graphs. This is helpful in exploring the relationships among objects and identifying memory leaks. However, the information exposed in this way is usually a snapshot and the history of how memory has been used goes missing. Moreover, they usually don't keep tracks of how objects are allocated. Developers have to infer how an object might be allocated and freed by himself/herself.
Another common approach is to plot the allocations or the memory usages along the timeline. This gives some intuition of how and when a bulk of objects are allocated. However, it still relies on developers' wisdom, and sometimes chances, to dig out the problematical code snippet.
This memory profiler is designed to solve the inconveniences and limitations. The goal is to identify the memory eager codes directly.
The profiler is designed at the very beginning to support not only JavaScript but also native codes. Naturally, not only JavaScript objects but also native allocations are tracked. The profile while recording is stored in memory in a very compact format. It's supposed to profile a very long time period without problem.
Timeline view
This view shows the allocation event across the period of time. It shows the overall memory usage history. Red is allocate and blue is deallocate.
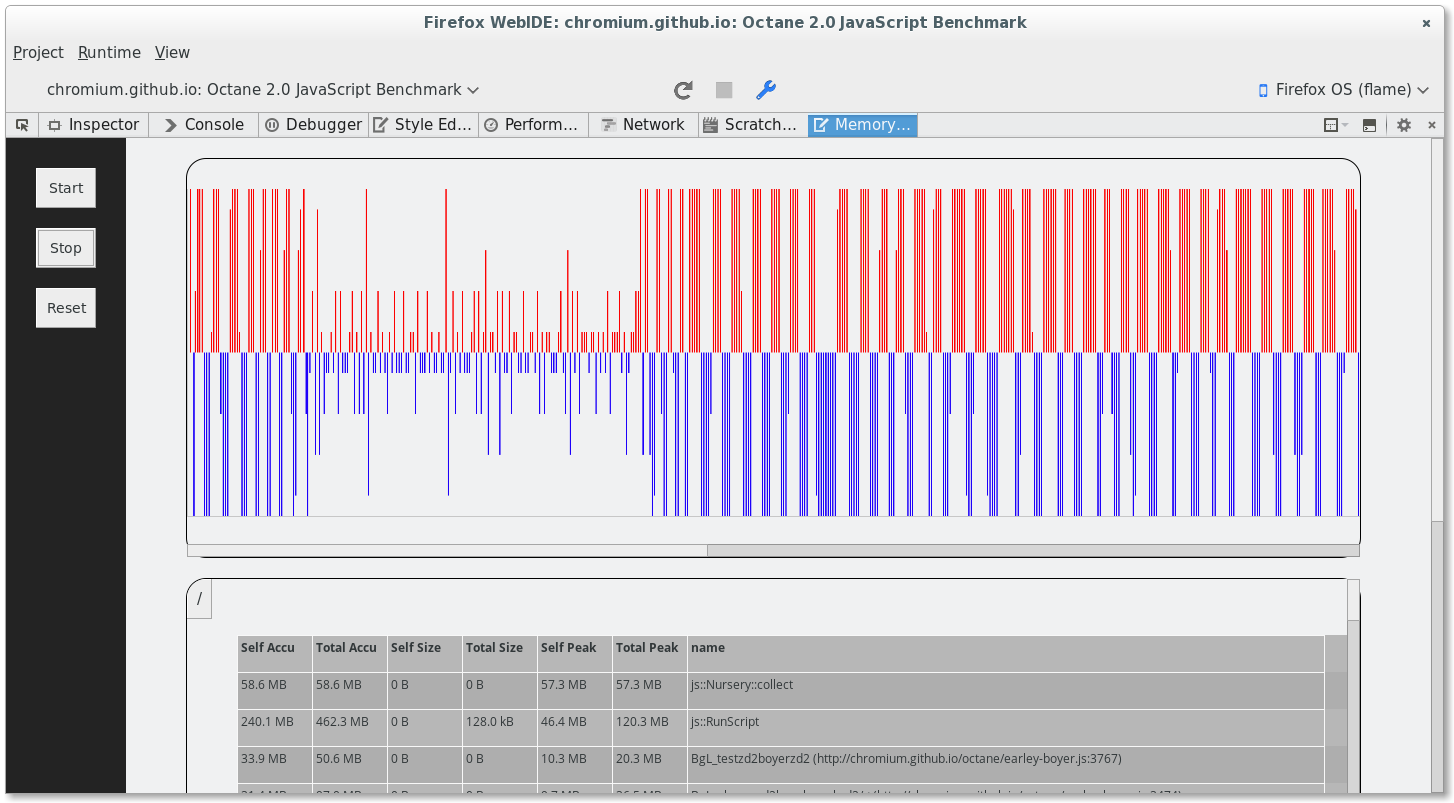
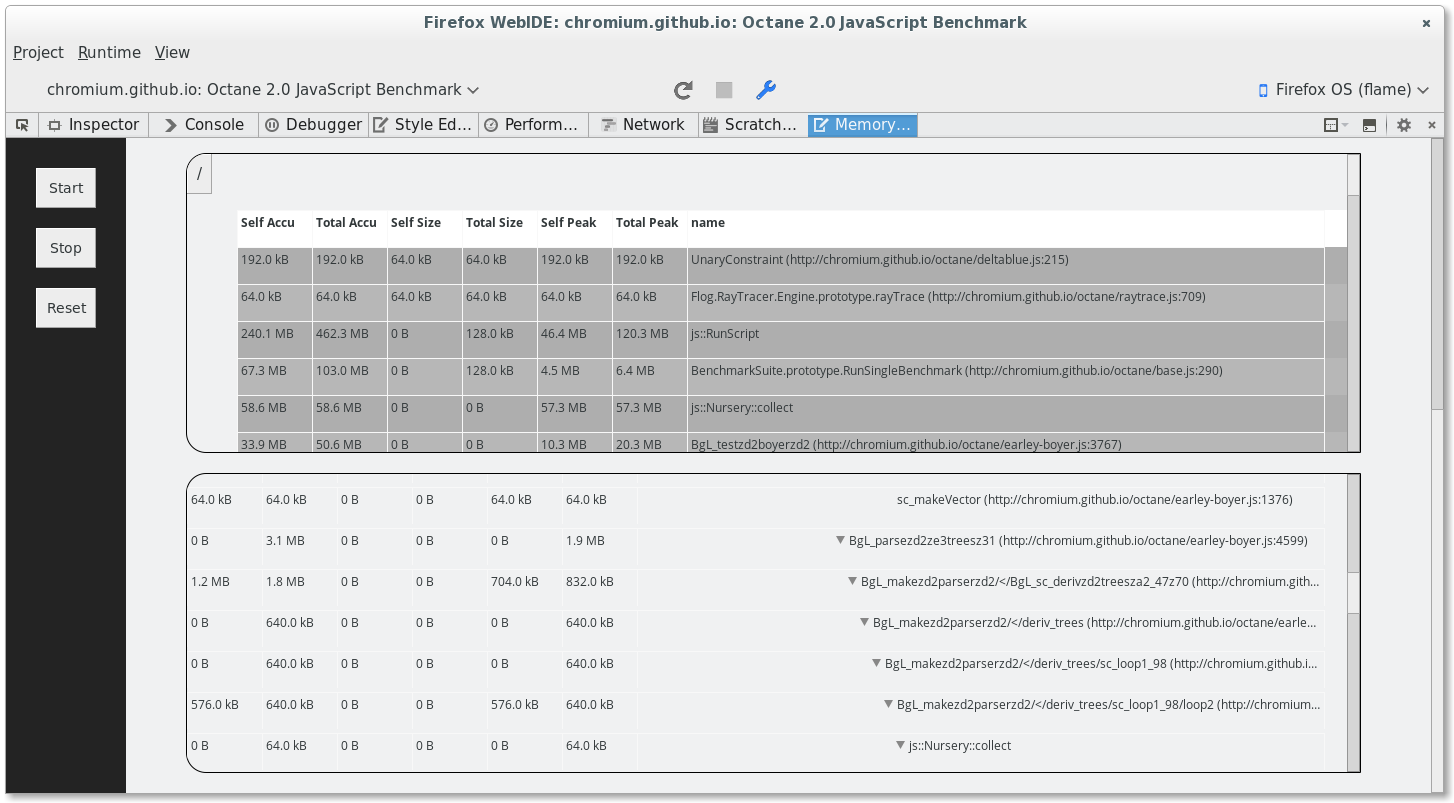
Rank-list view and tree view
The rank-list view shows top functions that are most memory eager. The table could be sorted according to the 6 measurements: {retained, allocated, peak} x {self, inclusive}.
The tree view shows functions as call trees. Each alloctaion root could be expanded to leaf functions that actually allocates memory.
Contribute
The memory profiler project page is at https://wiki.mozilla.org/MemoryProfiler.