
This document is talking about deprecated feature.
The tracing JIT in SpiderMonkey consists of a generic, low level component called nanojit which is co-maintained between Adobe and Mozilla, and a SpiderMonkey-specific high level component called jstracer. The nanojit component is language agnostic, and contains no knowledge about SpiderMonkey or any other part of the Mozilla codebase. The jstracer component consists of a monitor and a recorder. The monitor watches the executing SpiderMonkey interpreter. When the monitor determines that the interpreter has entered a region of code that would benefit from native compilation, the monitor activates the recorder. The recorder records the activity of the interpreter, using nanojit to build an efficient, native representation of the execution called a fragment. The monitor then calls into the native code stored in the fragment.
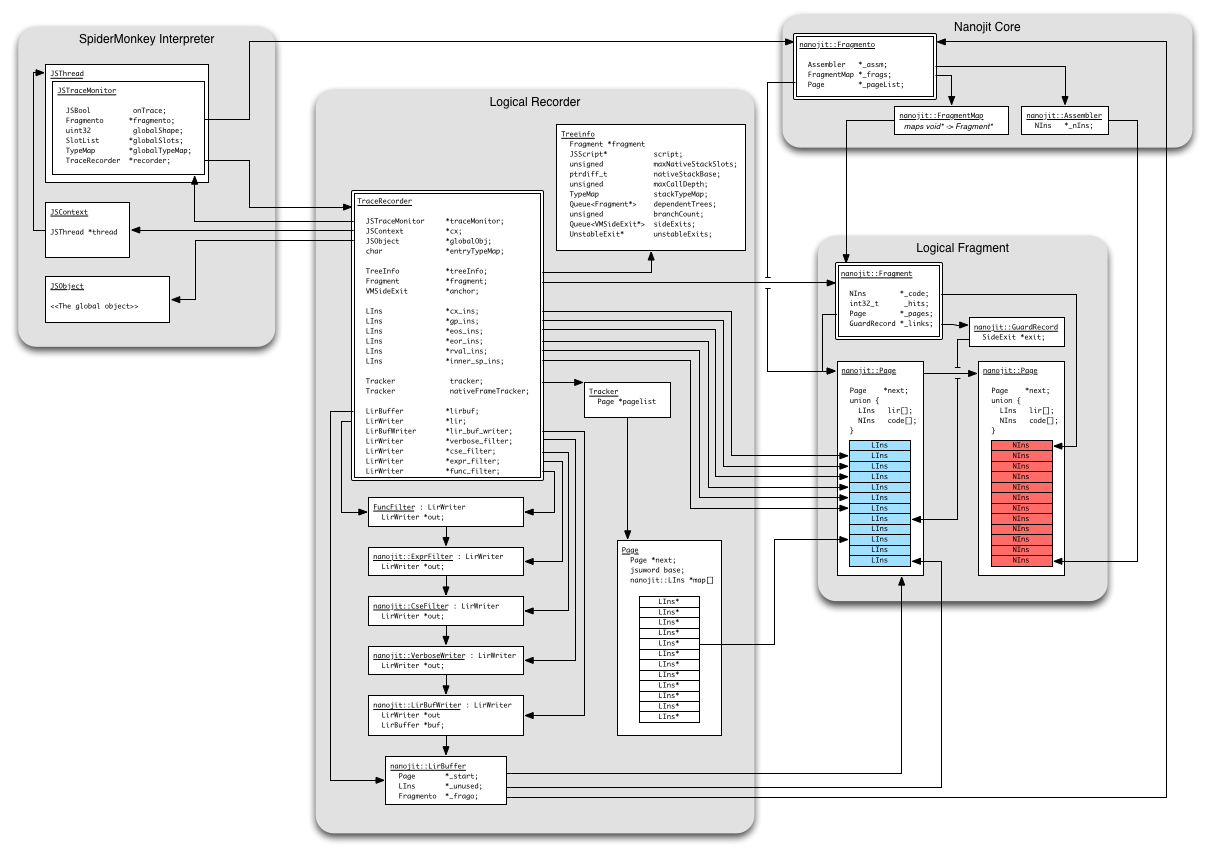
A schematic diagram of the components of the tracing JIT follows:
Generic low level component: nanojit/*
The files in the nanojit directory define the nanojit component.
nanojit/LIR.*
The nanojit/LIR.cpp and nanojit/LIR.h files define the intermediate representation LIR, which is used as input to nanojit. LIR is a conventional three-address, linear SSA code. A single instruction of LIR is called a LIns, short for "LIR instruction". LIns values are depicted in blue in the schematic diagram. In contrast, a single native instruction is called a NIns, and is depicted in red in the schematic diagram.
The recorder in jstracer inserts LIns values into a LIR buffer held in a page, itself contained within a logical fragment, and the nanojit compilation pipeline and Assembler transform the LIns values into NIns values.
nanojit/Fragmento.*
The nanojit/Fragment.cpp and nanojit/Fragmento.cpp files define the Fragment and Fragmento classes. A Fragmento is a resource-management object that allocates and stores a set of Fragments and Pages, and manages their lifecycle. A Fragmento owns its associated Fragments.
A Fragment represents a single linear code sequence, typically terminating in a jump to another Fragment or back to the beginning of the Fragment. A Fragment's code is stored in a set of associated Pages and GuardRecords allocated from the Fragment's owning Fragmento. A Fragment initially holds no pages. As the compilation pipeline inserts LIR instructions (LIns values) into the Fragment, it allocates Pages to store the LIR code. Later, when the Fragment is assembled, it will allocate Pages for the native code (NIns values) produced by the Assembler. When the Fragment is destroyed, it returns its Pages to the Fragmento for reuse.
nanojit/Assembler.*
The nanojit/Assembler.cpp and nanojit/Assembler.h files define the class Assembler, which transforms LIns values into NIns values. In other words, an Assembler transforms LIR code into native code. An Assembler is also able to modify existing fragments of native code, by rewriting native jump instructions to jump to new locations. In this way the Assembler can "patch together" multiple fragments, so that program control can flow from one fragment into another, or back out of generated code and into the interpreter.
An Assembler is the only component of the tracing JIT that reads or writes native code. Therefore an Assembler contains several machine-specific methods which are implemented in the accompanying nanojit/Native*.* files.
An Assembler runs in a single pass over its input, transforming one LIns value to zero or more NIns values. It is important to keep in mind that this pass runs backwards from the last LIns in the input LIR code to the first, generating native code in reverse. Running backwards sometimes makes the logic difficult to follow, but it is an essential factor in maintaining the Assembler's high speed and small size.
In the SpiderMonkey tracing JIT there is only ever one Assembler active at a time, associated with the currently active Fragmento.
nanojit/RegAlloc.*
Nanojit's register allocator. This is a local register allocator, meaning that it does not allocate registers across basic blocks. It is correspondingly very simple: register allocation is done immediately, step-by-step as code is being generated. A running tally is kept of assignments between registers and LIR operands, and any time a new LIR operand is required in a register a new one is assigned from the list of free registers. When all registers are in use, the least-often-used register currently in use is spilled.
nanojit/Native*.*
The files Nativei386.h, Nativei386.cpp, NativeARM.h, NativeARM.cpp, etc. each define architecture-specific methods within the Assembler class. Only one architecture-specific variant is included into any given build of the Assembler; the architecture is selected and fixed when the build is configured.
The architecture-specific methods found in these files are the only functions within nanojit or TraceMonkey that emit raw bytes of machine-code into memory.
SpiderMonkey-specific high level component: jstracer.*
The files jstracer.cpp and jstracer.h contain a the mechanisms of monitoring and recording the activity of the interpreter.
Each SpiderMonkey JSContext holds a trace monitor of type JSTraceMonitor.
The trace monitor maintains some book-keeping information, as well as the collection of recorded Fragments, held in a hashtable keyed by the interpreter's program counter and global object shape at the time of recording.
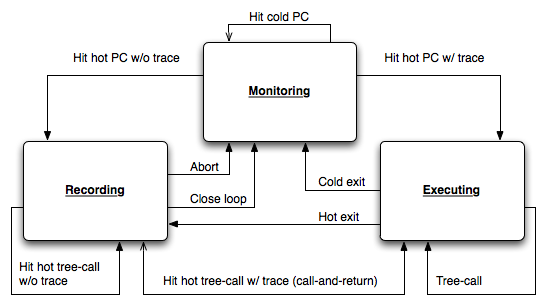
At any moment, the trace monitor is in one of three major states: monitoring, recording, or executing. The transitions between these states are somewhat complex and delicate, but the overall picture is simple:
Monitoring
The trace monitor's initial state is monitoring. This means that SpiderMonkey is interpreting bytecode. Every timeSpiderMonkey interprets a backward-jump bytecode, the monitor makes note of the number of times the jump-target program-counter (PC) value has been jumped-to. This number is called the hit count for the PC. If the hit count of a particular PC reaches a threshold value, the target is considered hot.
When the monitor decides a target PC is hot, it looks in a hashtable of fragments to see if there is a fragment holding native code for that target PC. If it finds such a fragment, it transitions to executing mode. Otherwise it transitions to recording mode.
Recording
When the trace monitor enters recording mode, it constructs a new trace recorder, of type TraceRecorder. It then passes control back to the SpiderMonkey interpreter. The interpreter continues interpreting bytecode, but with an important difference: each bytecode it interprets is also sent to the trace monitor and recorded in the monitor's trace recorder.
Recording mode is temporary -- ideally it only lasts as long as it takes to record a single iteration of a loop in the interpreter -- and can end in a number of ways. All transitions out of recording mode eventually involve returning to monitoring mode:
- If the recorder is asked to record a bytecode that it cannot, for various low-level reasons, faithfully record, the recorder may choose to abort the recording. Aborting a recording is always an option in tracemonkey, and on abort the monitor simply discards the recorder and its fragment and returns to monitoring mode. The monitor also keeps track of how many times it has attempted to record a trace starting at each PC value, so if a particular PC causes too many aborted recordings, the monitor blacklists the PC and will not attempt recording it any longer.
- If the recorder completes recording at a backward branch back to the initial PC value that triggered recording mode, it is said to have successfully closed the loop. A closed loop is passed through the nanojit Assembler and thereby compiled to native machine code. The associated fragment is placed in the monitor's fragment table and the monitor returns to monitoring mode, with a high likelihood of immediately transitioning to executing mode on the next bytecode interpreted. The compiled fragment of code returned to the monitor on successful loop-close is called a trace.
- If the recorder is asked to record a bytecode that implies a call to a native function elsewhere in SpiderMonkey -- some helper function written in C -- and that native happens to re-enter the interpreter to interpret yet more bytecode, and furthermore if that bytecode itself contains a hot PC that has not yet been traced, the trace monitor may be asked to begin nested recording. This is the same as normal recording mode, except that the outermost recorder is placed on a deferred-abort stack. When the innermost recorder completes -- successfully or otherwise -- every recorder on the deferred abort stack is aborted. This process is called deep aborting the suspended recorders.
Executing
When the monitor interprets a backward jump to a PC that it has a compiled trace of machine code for, the monitor enters executing mode. This mode is relatively simple compared to recording mode.
- First the monitor allocates a native stack for the trace to use, and a state structure containing various key pointers into the SpiderMonkey interpreter's state, including a pointer to the native stack.
- It then imports the set of
jsvalvalues from the SpiderMonkey interpreter that the trace is known to read or write during its execution. This set was determined during recording, and the imported values are stored locally within the native stack during execution. - The monitor then calls into the native code of the trace, passing in a pointer to the state structure as the sole argument.
- The native code of the trace runs, modifying the state structure and native stack, as well as calling native SpiderMonkey C functions, and reading from and writing to objects in the SpiderMonkey heap. The native code returns a pointer to a structure called a side exit.
- The monitor inspects the side exit and, depending on the exit condition, reconstructs a certain number of interpreter frames and flushes a certain set of writes back to the SpiderMonkey heap. Frame reconstruction is necessary because a trace may inline a number of function calls, and may exit before those function calls return. Write flushing is necessary because all writes to imported values in the native stack are deferred until trace-exit, as an optimization.
- If the side exit condition indicates that the trace exited successfully -- simply running out of native code or hitting a branch condition that no native code yet exists to handle -- the monitor will inspect the hit count for the trace-exiting PC. If that PC has itself grown hot, the monitor will immediately transition to recording mode starting with the exiting PC. Otherwise it will return to monitoring mode.
- If the side exit condition indicates that the trace exited unsuccessfully -- due to encountering sufficient memory pressure to trigger a garbage collection, running out of native stack space, expiring a timer or any similar abnormal condition -- the monitor returns to monitoring mode.
Some other terminology may be helpful when reading the code:
- The term guard denotes a condition that is checked by an executing trace to confirm that some assumptions made during recording still hold. If guard's condition fails to hold, the guard either jumps to an exit or, if the guard has been extended, jumps to a sub-trace that has been recorded under the opposite assumption as the guard was checking. For example, when recording any conditional branch in the SpiderMonkey bytecode, a guard will be incorported into the trace that checks the branch is taken the same way during execution as it was during recording. If this guard fails once, the trace will exit. If it fails enough times to become hot, the monitor will record an alternative sub-trace beginning at the guard and patch the code into the existing guard. Thereafter, when the guard fails it will jump to the specialized sub-trace.
- The term bail denotes "exiting a trace due to to a failed guard". When a guard bails, it means that there is no logic in the trace to handle the failed guard, and so the exit condition encodes the state of the interpreter before the guarded condition. The interpreter then re-executes the guarded condition, which will always succeed since the interpreter handles all outcomes of such a condition dynamically.
- The term deep bail denotes a special case of bailing: when a trace calls a native SpiderMonkey C function that gets part-way through executing and then forces a trace-exit (possibly due to a nested C function depending on not-yet-flushed state in the trace). A deep bail is special only insofar as it requires flushing the full set of deferred writes in the trace if it occurs (and further, requires that all registers holding temporary trace operands have flushed to the native stack before execution). Bailing from a regular guard involves executing precise per-guard write-flushing code, as the guard encodes a specific failed condition on a specific set of operands, and so the exit code can be much more fine-grained about and reconstructing the pre-bail state. A deep bail must be conservative because it is forced by the failure of an unknown condition elsewhere in native SpiderMonkey C code.