
Web Replay is no longer developed by Mozilla; however, the work continues as a standalone project. Learn more
Web Replay allows Firefox content processes to record their behavior, replay it later, and rewind to earlier states. Replaying processes preserve all the same JS behavior, DOM structures, graphical updates, and most other behaviors that occurred while recording. DevTools' Debugger and Console can be used to inspect and control the replay.
Getting Started
To enable Web Replay (macOS and Firefox Nightly only), go to DevTools Settings and select "Enable WebReplay". Web Replay's features can only be used in a tab that is recording or replaying. There are a few ways to start recording a tab:
- Record current tab
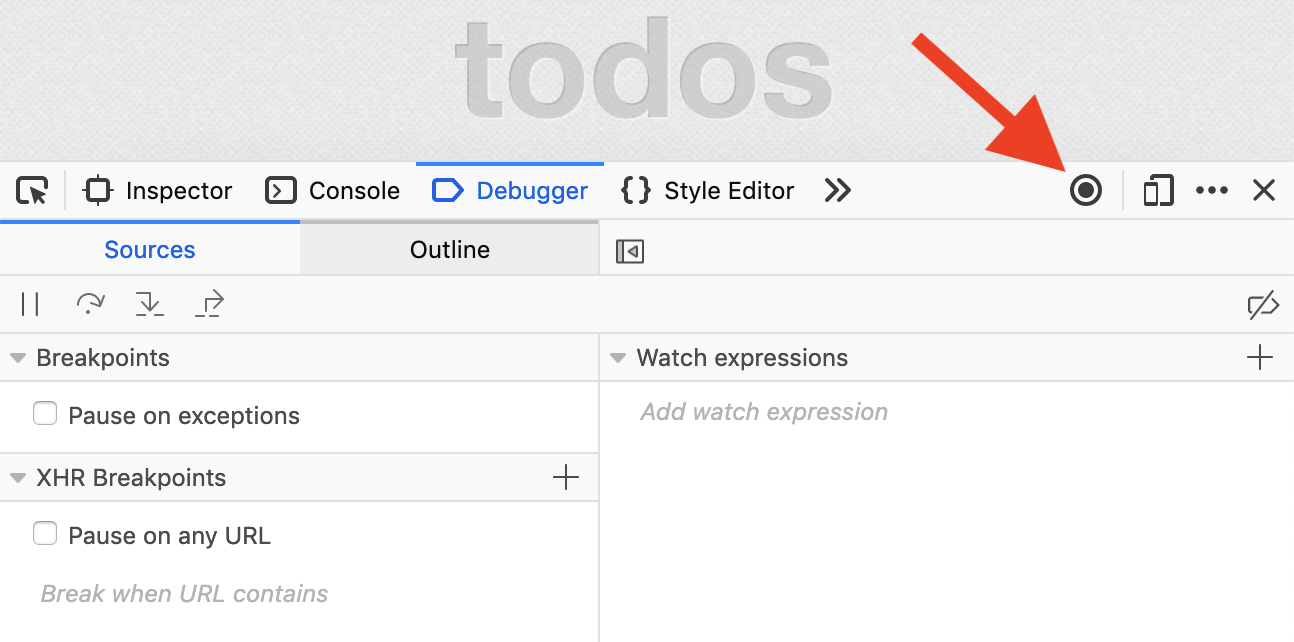
- Open the developer tools and click the button indicated below. This will refresh the tab and start recording. The button will be colored blue when the tab is being recorded. It can be clicked again to stop recording.
- Open a new tab in recording mode
- Click the 'Tools -> Web Developer -> Web Replay -> Reload and Record Tab' menu item. This has the same effect as above but can be used when the developer tools are not open.
- Open a saved recording in a new tab
- Click the 'Tools -> Web Developer -> Web Replay -> Open New Recording Tab' menu item to open a new blank tab that is recorded.
Live Rewinding
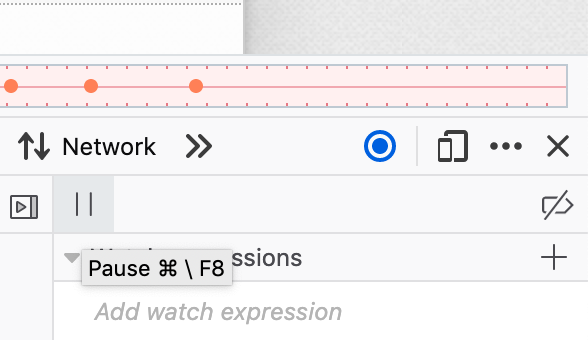
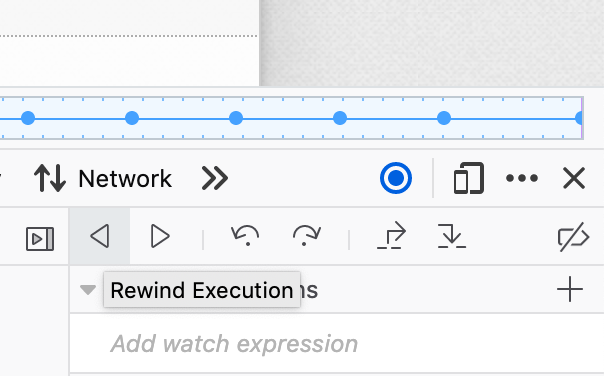
At any time while recording, the tab can be rewound to replay earlier behavior, all the way back to when the tab was opened or to the last time it navigated. An easy way to see this is to open the Debugger developer tool, press the pause button and then the rewind button.
While replaying old behavior, the tab can't be interacted with. To resume recording and interacting with the tab, press the pause button and then the play button to run forward to the end of the recording.
Save Recording and Replay on the Same Machine
Clicking the 'Tools -> Web Developer -> Web Replay -> Save Recording' menu item when a recording tab is open will allow the entire recording to be saved to a file.
Clicking the 'Tools -> Web Developer -> Web Replay -> Load Recording in New Tab' menu item will start a new tab which replays the recording to the end. The developer tools can be used to interact with this tab in the same way as a recording tab, though playing forward to the end will pause the tab instead of allowing further recording.
Save Recording and Replay on a Different Machine (partially implemented)
Recordings can be replayed on a different machine from the one which recorded them. This requires using the same build of firefox and a reasonably similar version of the operating system; otherwise the tab will probably crash. This feature has had little testing or polishing and there is not yet a good definition of 'reasonably similar'.
Time Travel Features
This section describes extensions to the developer tools that use time travel to help debug a recording/replaying tab.
Step Back
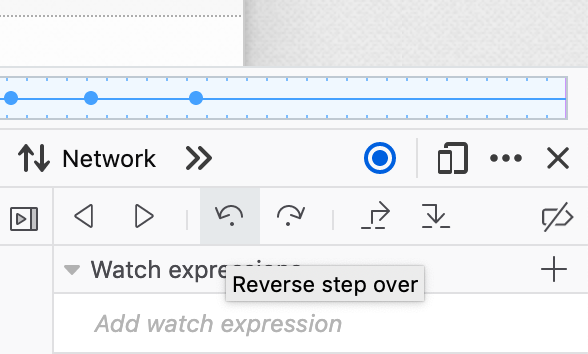
When paused, the reverse step button in the Debugger developer tool will step to the previous line executed and allow inspecting program state there. It is the opposite of the normal forward step button.
Rewind to Breakpoint
When paused, if there are any breakpoints set then the rewind button will run back and stop at the last time a breakpoint was set. It is the opposite of the normal button for playing forward.
Seek to Console Messages
Errors and logged messages in the Console developer tool can be clicked on to cause the tab to seek to the point in the recording where the error was generated or the message was logged. The tab will pause at this point and allow state to be inspected, forward/reverse stepping, and so forth.
Timeline
The timeline is shown above the developer tools and provides several features to help with navigating the recording:
- The timeline changes color depending on whether the tab is currently recording (red) or replaying (blue).
- The current position within the recording is shown on the timeline with a progress indicator.
- Console error/messages are marked on the timeline and can be clicked to seek to that point.
Advanced Options
Preferences
- devtools.recordreplay.enableRewinding When disabled, Firefox records a page signifcantly faster. default true.
- devtools.recordreplay.fastLogpoints When enabled, Firefox Web Replay evaluates logpoints consecutively. Logpoints cannot have side-effects or diverge from the recording in any othe way in this mode. default false.
- devtools.recordreplay.logging When enabled, Firefox will log Web Replay's internal actions to the terminal, which is helpful when debugging hangs and crashes. default false
Architecture
There are several main components to the project:
- The record/replay infrastructure records enough information during recording so that the replayed process can run and produce the same observable behaviors.
- IPC integration allows a replaying process to communicate with the chrome process using IPDL and shared memory.
- The rewind infrastructure allows a replaying process to restore a previous state, while still maintaining communication with the chrome process.
- Debugger integration allows the JS debugger to read the information it needs from a replaying process and control the process's execution (resume/rewind). The debugger is not allowed to change the replaying process's observable state.
Record/replay infrastructure
Broadly, reliable record/replay is achieved by controlling for non-determinism in the browser. This non-determinism originates from two sources: intra-thread and inter-thread. Intra-thread non-deterministic behaviors are non-deterministic even in the absence of actions by other threads, and inter-thread non-deterministic behaviors are those affected by interleaving execution with other threads, and which always behave the same given the same interleaving.
Intra-thread non-determinism is recorded and later replayed for each thread. These behaviors mainly originate from system calls (i/o and such).
Inter-thread non-determinism is handled by first assuming the program is data race free: shared memory accesses which would otherwise race are either protected by locks or use APIs that perform atomic operations. If we record and later replay the order in which threads acquire locks (and, by extension, release locks and use condvars) then accesses on lock-protected memory will occur in the same order. Atomic variables can be handled by treating reads and writes as if they were wrapped by a lock acquire/release during recording.
It is not enough, however, to just record all these non-deterministic sources and reproduce those behaviors exactly in the replaying process. The IPC and debugger integration components may behave differently between recording and replaying, or between different replays. Both of these involve inter-thread communication and calls to non-deterministic APIs, and the resulting non-determinism must be allowed within the replaying process.
Allowed Non-determinism
There is some slop in this design: The replaying process must be non-deterministic enough that the IPC and debugger components work, but not so non-deterministic that observable behaviors are affected. We resolve this slop by minimizing the tolerated non-determinism: The replaying process must be just non-deterministic enough that the IPC and debugger components work. In practice, non-deterministic replay is allowed in the following areas:
- Heap allocations can be performed by the IPC and debugger components and so can differ between recording and replay.
- JS compilations and some other internal state are affected by the debugger's presence and which hooks/breakpoints are active, and so can differ between recording and replay.
- The debugger can allocate GC things, and allocation of other GC things can differ in the debugger's presence. For example, script compilation involves GC thing allocation, and observing changes in an object will change its shape.
Relaxing non-determinism here has a number of ripple effects in other areas. Mainly, pointer values may differ between recording and replay, and the points where GCs occur, and the set of objects collected, may differ. This non-determinism is prevented from spreading too far with the following techniques:
- Different pointer values can affect the internal layout of hash tables. To prevent this from having an effect on iteration order (and execution behavior) in the table, the main table classes (for now PLHashTable and PLDHashTable) are instrumented so that they always iterate over elements in the order they were added when recording or replaying.
- Differing GC behavior can cause object finalizers to run at different times. To prevent this from having an effect on execution behavior, GC finalizers which can affect the recording are instrumented so that the finalizer action is performed at the same time in the replay as it was during the recording. Even if the associated JS object has not been destroyed yet during the replay, it will never be used again because at this point in the recording it has been finalized.
- Similarly, GC behavior can cause values read from weak pointers to differ between recording and replay. If this difference can affect the recording, the weak pointer must be instrumented so that during replay it holds onto its target for the same duration it was held while recording.
Recording
A recording content process differs from a normal content process in the following ways:
- Calls to certain functions are intercepted by hooking them (rewriting the machine code at their entry points to call a different function with the same signature), including the function used to dispatch mach messages. When a call or message is intercepted, the wrapped call/message is first performed normally and then it and its outputs are recorded in a data stream for the thread performing the call. During execution of the wrapped call/message, recording of any inner calls is suppressed, so that they are performed normally without affecting the recording. The functions which are intercepted are generally at the system call and the system library level. In general, any function which is not compiled as part of Gecko is fair game.
- Acquisition order of locks is recorded in a data stream for each lock. Some locks which are associated with non-deterministic components are not recorded, such as the JS GC and helper threads locks.
- Accesses on atomic variables/fields are recorded in a global data stream, as if they were all protected by a global lock. Some atomics are related to non-deterministic components and are excluded from this stream.
- Threads use file descriptors to wait on locks and notify each other, instead of using the native implementation for locking and condition variables. At least on Mac, pthreads locks/cvars seem to use a mix of process-local and kernel state, and sometimes don't work correctly after rewinding the process.
- Some behaviors are changed to simplify recording, in ways that should not affect observable behaviors. For example, incremental GCs (a non-deterministic component) work by posting events to the main thread (a deterministic component), so for now incremental GCs are disabled. Many of these behavioral changes should eventually be removable.
- Graphics rendering is entirely local to the content process. Instead of communicating via IPC with a Compositor in the UI process, there is a Compositor in the recording process itself which performs the rendering.
- Some additional instrumentation is performed, per the 'Allowed Non-determinism', section above.
- The IPC, rewind, and debugger components are all active while recording. These spawn a number of threads which do not participate in the recording: any events they execute are live. See the sections below for details on how these affect the process' behavior.
To make it easier to ensure that the non-deterministic components do not have an effect on recorded behavior, certain code regions can be marked as disallowing events — while executing them no thread, lock, or atomic events should be recorded. This is done in code associated with the non-deterministic components, such as during GC or Ion compilation, to help track down behaviors that should go unrecorded.
Replaying
A replaying content process behaves in the same way as a recording process, except for the following:
- The calls and mach messages which were intercepted during recording are also intercepted here. When a call/message is intercepted, the wrapped call/message is not performed, but rather the results of the call/message are read from the data stream and returned to the caller, emulating the behavior of the call/message. This requires the process to be deterministic enough that events play out in the same order on each thread between recording and replay. The data stream should have enough error checking in place that we can immediately detect if the replay has gone out of sync with the recording.
- The recorded data streams which specify the acquisition order for each lock are read from and used so that locks are acquired in the same order. When a thread tries to acquire a lock, it first waits until it is next in line to do so.
- Similarly, atomic accesses which were included in the recording will occur in the same order during replay, as if they were all protected by a single global lock. Note that while this could potentially be a big drag on performance during both replay and recording, many of the hottest atomics (refcounts, GC counters, and so forth) are associated with non-deterministic components and are not recorded.
IPC integration
Communication between the chrome process and a recording or replaying process — hereafter referred to as the child process — is managed via a separate middleman content process. The child process is extended so that it can communicate with the middleman, using a special bidirectional channel and messages separate from IPDL state.
Middleman process
The middleman is the same as a normal content process, except that it spawns and communicates with the child process, and avoids creating any documents itself. Using the middleman provides the following advantages:
- IPDL communication is greatly simplified. The chrome and middleman processes communicate using the standard browser protocols (PContent, PBrowser, etc.) and implementations for their actors, while the middleman and child processes communicate with their own channel and messages, which is tuned to the demands of the recording/replaying process.
- The middleman can perform actions that would be extremely difficult to manage in a replaying process without going out of sync with the recording. This mainly includes running devtools content-side scripts.
- The middleman can spawn multiple child processes at once, and coordinate their behavior so they run in parallel. There can be up to one recording child and two replaying children at once. The advantage of spawning both recording and replaying children is that by switching between different children the middleman can effectively rewind a live recording, then play forward and allow the user to resume interacting with the tab after they have finished inspecting state in the past. The advantage of using two replaying processes is to provide a smoother experience when rewinding.
Recording/replaying process extensions
During initialization the child process spawns a thread that does not participate in the recording — any IPC or other system calls it performs are live, even when replaying. This thread sends and receives messages from the middleman.
Messages describe actions the child process is able to do independently from the recording; currently this includes sending graphics updates, taking and restoring process snapshots, and responding to debugger requests.
Rewinding infrastructure
A child process can be rewound to an earlier state in response to a message from the middleman. After a recording process rewinds, it becomes a replaying process. Rewinding happens by periodically taking memory snapshots during execution, and then later restoring them. Care must be taken for efficiency when taking/restoring snapshots and for managing system resources when restoring.
Snapshots
Late in process initialization the first snapshot is taken, which is simply a copy of the stacks/registers for each thread. Each subsequent snapshot includes copies of thread stacks/registers as well as a diff containing the original contents of all pages of heap and static memory that were modified since the previous snapshot. Certain memory regions are excluded from snapshots; these memory regions are allocated with a special API and are used for state that needs to be preserved when rewinding. Snapshot data may be stored in memory or on disk. Diffs are computed by first setting up an exception handler thread (mac only) very similar to the one used by asm.js. When taking the first snapshot all addressable memory in the process is enumerated and write-protected, and as faults occur a special exception handler thread unprotects the memory, copies its contents and marks it as dirty. When the next snapshot is taken, only the dirty memory is examined for any changes vs. the copy made.
This mechanism requires intercepting mmap (or similar low level allocation functions) so that any newly addressable memory is known — anonymous mappings would not otherwise be intercepted or included in the recording, as heap allocation is non-deterministic while replaying. mprotect is intercepted and nop'ed to avoid interference with the dirty memory mechanism, and munmap is intercepted with no actual unmapping performed, so that memory does not need to be remapped when restoring a snapshot (a set of free regions is maintained to allow reusing this memory).
All snapshots are taken from the main thread. Before taking the snapshot, all threads participating in the recording must enter an idle state, waiting on a thread-specific condition variable. Threads enter this state whenever they are waiting to acquire a lock or perform an atomic action that is part of the recording. While recording, threads may make blocking calls to libraries (e.g. kevent). To allow these threads to be snapshotted, the call is instead performed on a separate thread that does not participate in the recording, so that the calling thread may enter the correct idle state even while its progress is blocked on the call completing. Once all thread are idle, the main thread computes the memory diff, reads the stacks from each thread and their register state (which each thread recorded by calling setjmp before idling).
Restoring snapshots is also done from the main thread. As for taking a snapshot, all other threads enter an idle state. The dirty memory information computed since the last snapshot was taken is used to restore the heap to the state at that last snapshot, and then the memory diffs can be used to restore an earlier snapshot if necessary. Threads are individually responsible for restoring their stacks; when they wake up from the idle state they see the main thread has prepared a new stack to restore to, so they longjmp to the new register state and copy in the new stack's contents.
Managing system resources
When the child process restores a snapshot, the state of any system resources it has open is unchanged. Care must be taken to make sure these resources are coherent to the process after the restore completes. This is done in the following ways:
- Instead of creating or destroying threads on demand, while recording/replaying all threads which will be needed are created during process initialization. If during the recording the content tries to create more threads than were spawned up front, then the recording fails. These threads idle until the recording/replaying content tries to 'create' them, then they run their main function, and after completing it will idle indefinitely. This ensures that no matter when we create or restore a snapshot, the same set of threads will exist and will have consistent stacks locations.
- Locks and condition variables are to some extent system resources, and to avoid problems we make sure each thread is waiting on a consistent variable when saving or restoring a snapshot (see section above).
- IPC integration uses a file descriptor for communicating with the middleman. This is left alone when restoring a snapshot, so whenever saving or restoring a snapshot they should be in a consistent state for the child process. Constraints are used for when messages may be sent between the middleman and child process, ensuring that the middleman process cannot send a message at a time when the child process may be rewinding.
Debugger integration
When debugging a normal content process, the devtools JS debugger runs quite a bit of JS code in the content process, communicating with the chrome process primarily through streams of JSON data. When debugging a child content process, this JS code runs in the middleman process. When the code creates a Debugger object, that Debugger provides information about the child process rather than the current (middleman) process. While the Debugger can indicate it is for a child process, the interface should be as transparent as possible to the devtools JS code; the Debugger can still create script/object/etc. debug objects, which refer to specific things in the child process.
As with the devtools JS code, this Debugger lives in the middleman process, and instead of wrapping things from another compartment the debug objects hold heap structures with information about some thing in the child process. The Debugger can explore the heap by sending messages to the child process to fill in the contents of the debug objects it creates. Whenever the Debugger is interacting with the child process the child process is paused at some point in execution, and the contents of the debug objects are only valid until the middleman notifies the child process that it can resume forward execution or must rewind to an earlier snapshot. When the child process pauses again (at a breakpoint, say) the debug objects must be reconstructed.
There is an exception to this, for scripts and script source objects; debug objects for these will continue to hold the same referent after resuming or rewinding the replaying process. This is necessary for script breakpoints to work, and is implemented by ensuring that the ordering of creation of scripts and script sources is deterministic (mainly by disabling off thread parsing, which is one of the behavior changes during recording/replay).
The user's interface to the devtools for a child process is the same as for a normal content process, except that new UI buttons are added for rewinding (find the last time a breakpoint was hit), and for reverse step/step-in/step-out. For now only JS state can be inspected by the debugger, though extending this to cover DOM inspection and other devtools features should not be too hard.
Unrecordable executions
There are restrictions on the executions that can be recorded. These should all be detectable during recording, so that we don't attempt to replay an execution we know will not match up with the recording. The following executions run into fundamental limits of the approach and cannot be replayed:
- Executions which throw overrecursion JS exceptions can't be reliably replayed; overrecursion happens at different times depending on how scripts are compiled, which can vary between recording and replaying.
- Similarly, executions which run out of memory at some point can't be reliably replayed.
- Executions which are stopped at some point by the slow script dialog can't be reliably replayed. Keeping track of the exact point where an interrupt occurred would require quite a bit of recording overhead, and it doesn't seem worth it to try to do this.
The following executions are unlikely to be supported by the initial release, but should be able to be handled at some point in the future:
- On x64, asm.js code relies on mprotect to handle out of bounds heap accesses; mprotect works differently while replaying, so some cooperation will be needed between the asm.js exception handler and the dirty memory exception handler.
- Shared array buffers can be used by web content to introduce data races to the browser on the contents of those buffers, going against a fundamental assumption of the record/replay infrastructure. Recording and replaying executions using these buffers will require new techniques like treating all accesses on the buffers as atomic (probably unacceptable overhead) or performing all accesses on the buffer on a single core and keeping track of context switches.
- DOM workers are not supported yet. For simplicity, debugger integration is currently only able to handle JS code that runs on the main thread.
- WebGL is not supported yet, as it uses a pretty different rendering path from normal web content.
- Media elements are not supported yet, as many of these run third party multithreaded code which hasn't been tested with the infrastructure.
Porting
Almost all implementation work so far has been on macOS. Windows port work is underway, but is not yet working. The difficulties are in figuring out the set of system library APIs to intercept, in getting the memory management and dirty memory parts of the rewind infrastructure to work, and in handling the different graphics and IPC pathways on different platforms.
Comparison with other projects
There is lots of existing work in this area. The closest projects are rr, WebKit's replay project, and Microsoft's Time-Travel Debugger. Compared to rr:
- This should work on all platforms and architectures supported by Gecko, though with substantial port work required.
- This will be part of Gecko itself, rather than a separate tool, which means both that developers won't need additional software to use it and that this can't be used to debug other software.
- This can use multiple cores during recording and replay.
- This does not preserve exact behavior. Context switches can occur at different times and data races can lead to different behavior between recording and replay. Data races are bugs in and of themselves, however, so this sort of non-determinism should be fixed regardless.
- This design allows the replaying process to behave differently from the recording process, which allows for a fairly straightforward implementation of IPC and Debugger integration.
Microsoft's and WebKit's replay projects operate at a higher level than rr. Inputs to the browser and non-deterministic behaviors are recorded so that they can be replayed later. In Microsoft's project the abstraction layer appears to be the boundary between the JS engine and the rest of the browser, while in WebKit's project the layer appears to be at internal WebKit APIs that can cause JS to run or the behavior of JS code to vary.
Broadly, all of these projects sit on a spectrum: at what level is the boundary between components whose behavior is recorded and the rest of the system? rr records all behavior in the user space of a process; the boundary is the system calls which are made into the kernel. This project records all behavior outside of system library calls which the process makes, with exceptions carved out for the allowed non-determinism and for draw targets. Microsoft's and WebKit's projects record a smaller subset of the browser's behavior.
This project is at a good point on this spectrum. Compared to a higher level project, this is able to operate on stable, thoroughly documented library APIs. By focusing on intercepting these APIs, browser instrumentation, recording overhead, and the maintenance burden going forward are all minimized. Compared to a lower level project, this is able to tolerate more non-determinism. All code whose behavior is recorded is compiled into Gecko (rather than being part of immutable, usually closed-source libraries) and can be lightly modified to deal with behaviors that function intercepting cannot handle, such as varying hash table layouts and the ordering of atomic accesses.
Appendix: Debugger details
Here is some more detailed information about how a recording/replaying process affects the debugger, and options for future improvements.
Debugger changes
From the perspective of a devtools server, debugging a recording/replaying process is very similar to debugging a live process. When execution is paused, the Debugger JS object and its various child objects can be used to inspect the execution state in the same way for a either kind of process. Here are the main differences:
- Explicit commands must be sent to the debugger to control execution. The
replayResumeBackward()andreplayResumeForward()members may be called to resume execution, and the replayPause() member may be called to pause execution at the next opportunity. A child process can only pause at breakpoints and at snapshot points (currently these only happen when graphics updates are performed, at which point there is no JS on the stack). - There is a new
onPopFramehandler, which is needed when doing reverse-step-in operations. - Operations on the debuggee which require interaction with the system will fail. These operations may be property accesses, evals, or object calls, and an example is accessing the
fontproperty of aCanvasRenderingContext2D. Failed operations currently just produce a placeholder "INCOMPLETE" result. - Operations on the debuggee which have side effects —
eval("x.f = 3")— should be avoided. When the process resumes forward or backward these side effects will be lost (the process reverts to its original state) and while paused at a breakpoint these effects can cause some strange behavior — after the above eval, getting the x.f property directly could produce a different value fromeval("x.f"). While the strange behavior could be fixed (it's due to caching) it would be good to prevent or at least discourage users from performing such effectful operations. - The underlying object of a
Debugger.Objectis inaccessible;object.unsafeDereferenceisnull. - As described above under "Debugger integration", child objects besides scripts and script sources become invalid when the debugger resumes execution, and must be reconstructed each time the replaying process pauses.
Inspecting a replaying process
Access to JS objects in the replaying process is currently only done through the JS Debugger interface — Debugger.Object, Debugger.Frame.eval, and so forth. This interface overlays a separate implementation from the C++ Debugger, implemented in devtools/server/actors/replay/debugger.js. This communicates with the replaying process via JSON and is fairly easy to extend for new features (such as web console support).
Appendix: Impacts on Gecko development
Web Replay is designed to minimize the places where other parts of Gecko need to know about it or interact with it. There are, however, areas where Gecko development is impacted by Replay. This section describes the main areas where ongoing development can break Replay and cause its tests to fail. needinfo? :bhackett on Bugzilla with any questions or concerns.
On treeherder, Web Replay tests currently only run on MacOS opt builds, and are prefixed with browser_dbg_rr.
Calls to new library functions
Most non-deterministic behaviors in a recorded/replayed process are captured by redirecting the system library functions which the process calls into — rewriting their machine code so they invoke a record/replay specific function with the same signature, which records any results of the function and then replays those results later without actually invoking the underlying library function. Redirected functions include both low level system call wrappers like sendmsg/recvmsg, and higher level functions such as various Cocoa interfaces. The list of redirected functions can be found in toolkit/recordreplay/ProcessRedirectDarwin.cpp.
When calls are added to Gecko for new system library functions, those functions may need redirections. In general, redirections are needed for any function that is (a) not compiled as part of Gecko, and either (b) may behave differently between recording and replaying, or (c) depends on data produced by other redirected functions (for example, CoreFoundation types like CFArrayRef and CFStringRef). A simpler way of telling that a redirection is needed for a function is that the replay tests crash inside it while replaying.
New redirections can be added to toolkit/recordreplay/ProcessRedirectDarwin.cpp, adding just a few lines for functions with simple interfaces using the various RRFunction macros. Missing redirections can also be temporarily worked around by avoiding the call when mozilla::recordreplay::IsRecordingOrReplaying().
Recording events in disallowed areas
GC marking and finalization may behave differently when recording and replaying, and recording events for a thread — calling redirected library functions, using recorded locks or recorded atomics — is disallowed at these times. There are some other areas where recorded events are also disallowed, such as during JS interrupt callbacks. Recording an event in one of these areas will fail a !AreThreadEventsDisallowed() assertion.
These failures usually result from accessing a recorded lock or atomic. Core xpcom and mozglue lock classes and mozilla::Atomic atomics are recorded by default, but many locks and atomics don't actually need to be recorded in order to correctly replay. Recording for a lock or atomic can be turned off by specifying recordreplay::Behavior::DontPreserve in either the lock's contructor argument or the atomic's template arguments.
Interactions with the middleman process
When recording or replaying an execution, there is an extra content process involved, the middleman process as described above. The presence of the middleman requires special handling in IPC internals and some graphics code. Additionally, IPC channels used to communicate with middleman processes can also communicate with the recording process child of the middleman. Problems can happen if IPDL actors for a protocol are setup by both the recording and middleman processes, while the UI process only expects to see one such actor. The usual solution here is to avoid setting up the actor in the middleman process, when mozilla::recordreplay::IsMiddleman().