
The debugger shows the source code for all running worker threads — web workers, service workers, etc. — listed in the sources list. You can open the JavaScript file for the worker process and set breakpoints and logpoints just as you can with JavaScript code running on the main thread.
Inspecting worker code
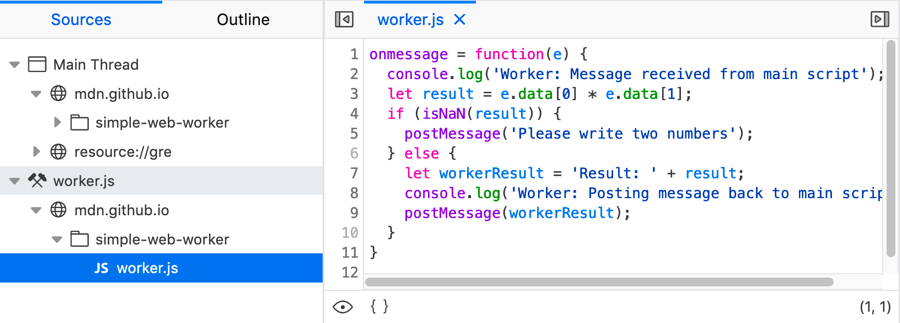
For example, see the selected item worker.js below — it is listed in a separate thread in the sources list, but appears in the source pane in the same way as main thread code when selected.
Setting breakpoints, etc.
You can set a breakpoint (or logpoint) on any active worker thread:
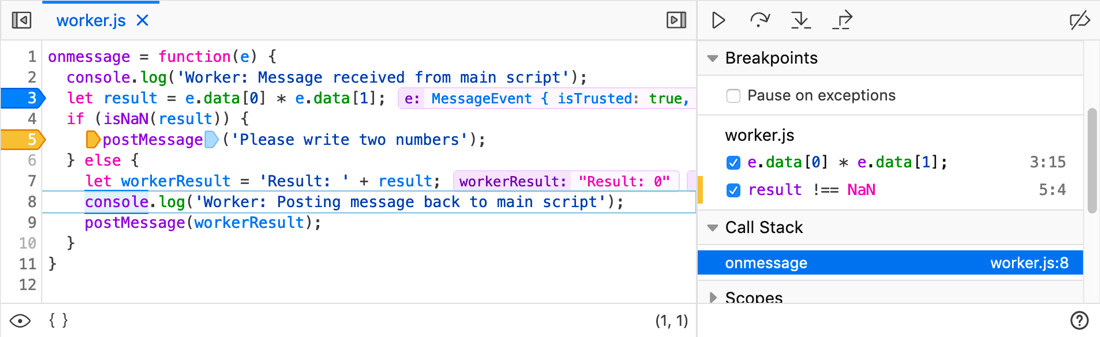
When execution is paused in a worker thread, the context of the debugger is updated to show the correct breakpoints, call stack, etc., just as you'd expect.