
This feature isn't yet supported in the new debugger. If you need to use it, you can, for now, switch back to the old debugger by visiting about:config and setting the "devtools.debugger.new-debugger-frontend" preference to false.
To see the docs for the old debugger, please visit Debugger (before Firefox 52).
Examine variables
When the code has stopped at a breakpoint, you can examine its state in the variables pane of the debugger:
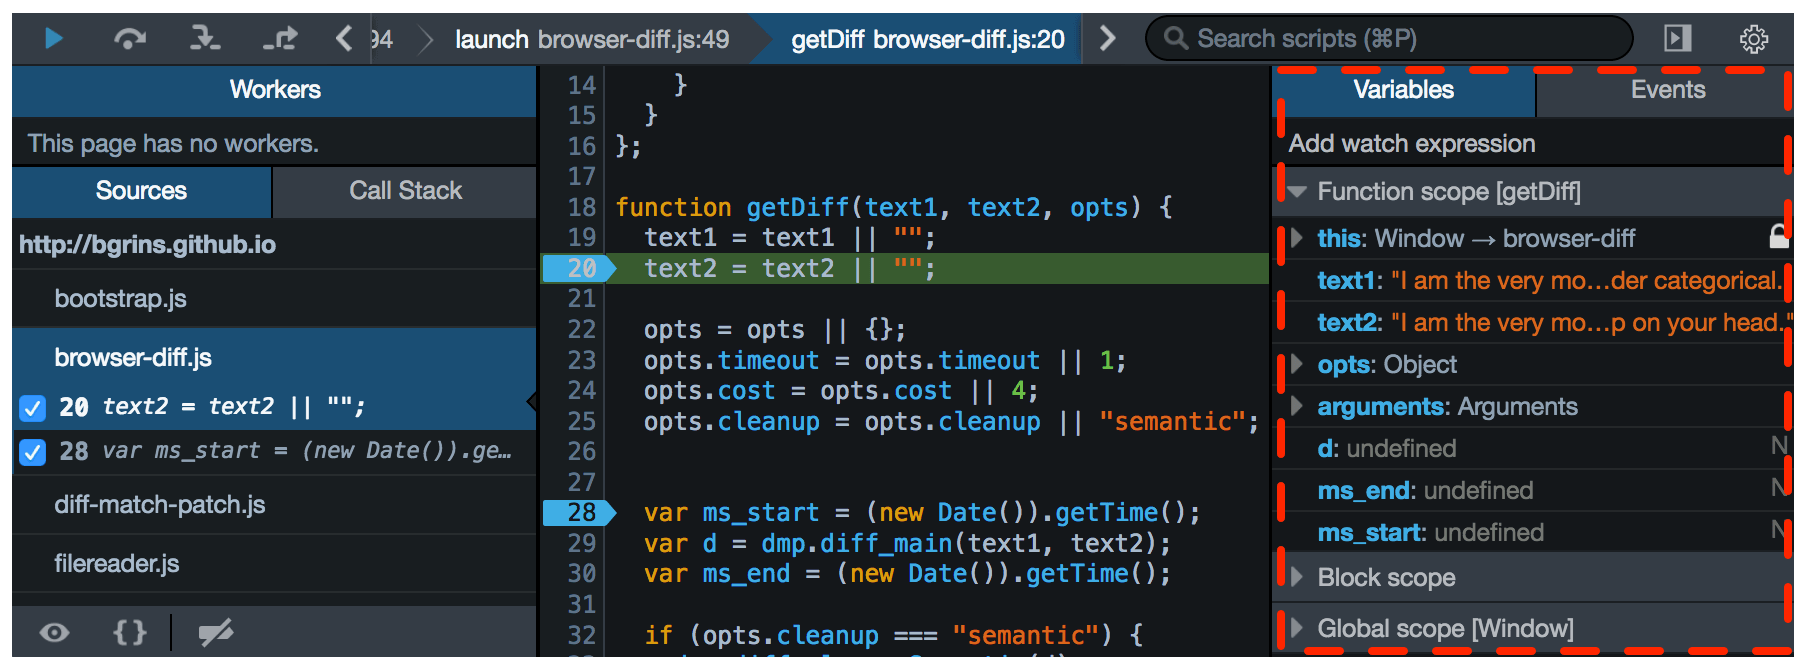
Variables are grouped by scope: in Function scope you'll see the built-in arguments and this variables as well as local variables defined by the function like user and greeting. Similarly, in Global scope you'll see global variables you've defined, like greetme, as well as built-in globals like localStorage and console.
Each object can be expanded, using a disclosure triangle, to show its properties.
Pointing your cursor at a variable's name displays a tooltip that provides additional information about the variable. See Object.defineProperty() for details on what these property descriptors mean.
You can filter the variables that are displayed, either by using the "*" modifier in the script filter, or by typing into the filter variables box, if you have enabled this in the debugger settings.
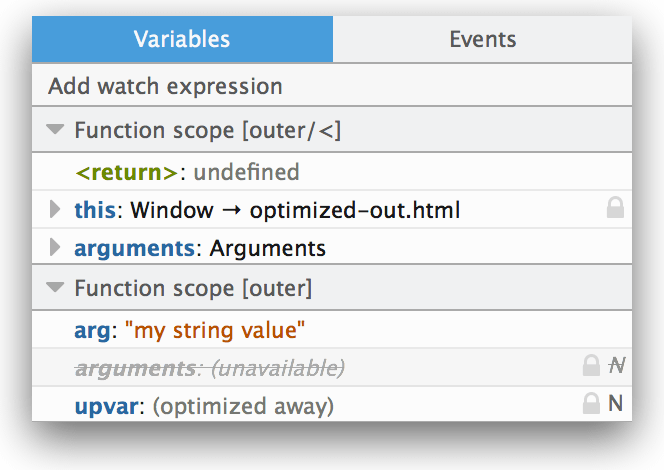
If a variable exists in the source but has been optimized away by the JavaScript engine, then it is shown in the Variables view, but is given the value (optimized away), and is not editable. In the screenshot below the variable upvar has been optimized away:
Modify variables
When the code has stopped at a breakpoint, you can modify variables in the variables pane of the debugger. Just click on the variable's current value and you'll be able to type there:
Watch an expression
Watch expressions are expressions that are evaluated each time execution pauses. You can then examine the results of these expressions. These are useful in that they let you inspect invariants in your code that you know are there but aren't necessarily in the code ready for inspection. To add a watch expression, click in the box that says "Add watch expression" and enter a JavaScript expression whose output you'd like to monitor as you step through code.
Then start running your code. The watch expression does nothing until you begin to step through your code, so nothing happens until you reach a breakpoint. At that point, a box showing your active watch expressions and their current values will appear:
You can step through your code, watching the value of the expression as it changes; each time it does, the box will flash briefly yellow. You can remove a watch expression by clicking the "x" icon next to it, and, of course, you can have more than one watch expression at a time.