
This feature is useful when debugging source-mapped code. It enables you to see the variables from the original source. It’s also possible to inspect variables from the generated scopes (e.g., a bundle file with all concatenated module files).
Let's take a look at how this works. If you want to follow along, use this example.
- Open the example page and then open the debugger using Tools > Web Developer > Debugger (or press Ctrl + I and then select the debugger).
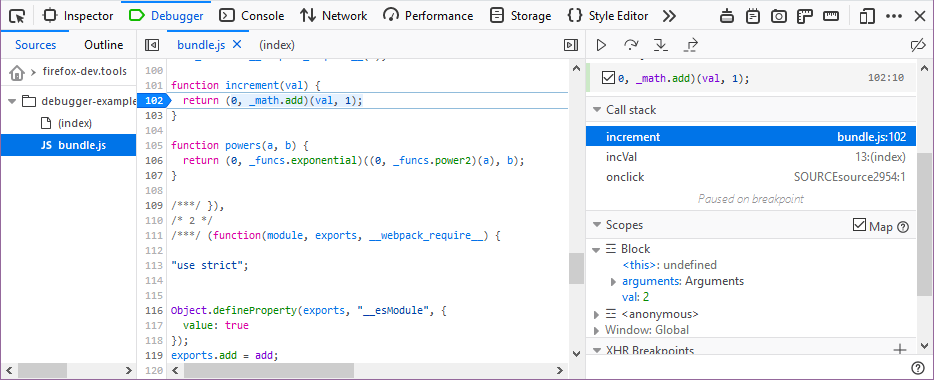
- Select the "bundle.js" file in the Sources panel on the left and then set a breakpoint at line 102 in the
incrementfunction. - When you click the increment button on the page and hit the breakpoint, an additional section is added to the right-hand panel below the Call stack to display variables mapped from the original scope, like this:
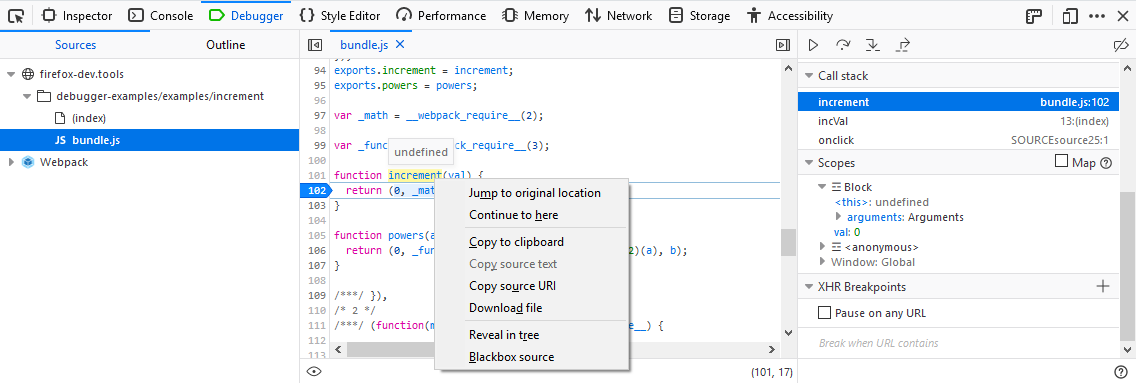
- As useful as this is, it would be even nicer if you could view the original code (before it was packages into the "bundle.js" file. Right-click on the source code and the context menu now includes an option to Jump to original location as shown below.
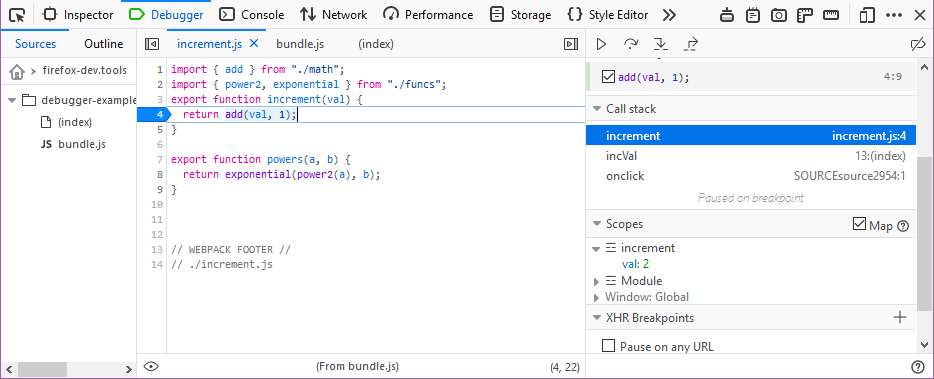
- Click Jump to original location. The debugger opens the file "increment.js" so you can view the original code. Notice that your breakpoint is set here in the original code as it was in the corresponding line in the "bundle.js" file. And, since Map has been checked in the Scopes panel, you also see variable symbols from the original code.
Using this feature is expensive in terms of resources, but it certainly makes your life easier when you have to debug source code that has been packaged webpack or a similar tool.