
This page list a few tips to help you investigate issues related to SpiderMonkey. All tips listed here are dealing with the JavaScript shell obtained at the end of the build documentation of SpiderMonkey. It is separated in 2 parts, one section related to debugging and another section related to drafting optimizations. Many of these tips only apply to debug builds of the JS shell; they will not function in a release build.
Debugging Tips
Getting help (from JS shell)
Use the help function to get the list of all primitive functions of the shell with their description. Note that some functions have been moved under an 'os' object, and help(os) will give brief help on just the members of that "namespace".
Getting the bytecode of a function (from JS shell)
The shell has a small function named dis to dump the bytecode of a function with its source notes. Without arguments, it will dump the bytecode of its caller.
js> function f () {
  return 1;
}
js> dis(f);
flags:
loc     op
-----   --
main:
00000:  one
00001:  return
00002:  stop

Source notes:
 ofs  line    pc  delta desc     args
---- ---- ----- ------ -------- ------
  0:    1     0 [   0] newline
  1:    2     0 [   0] colspan 2
  3:    2     2 [   2] colspan 9
Getting the bytecode of a function (from gdb)
In jsopcode.cpp, a function named js::DisassembleAtPC can print the bytecode of a script. Some variants of this function such as js::DumpScript etc are convenient for debugging.
Printing the JS stack (from gdb)
In jsobj.cpp, a function named js::DumpBacktrace prints a backtrace à la gdb for the JS stack. The backtrace contains in the following order, the stack depth, the interpreter frame pointer (see js/src/vm/Stack.h, StackFrame class) or (nil) if compiled with IonMonkey, the file and line number of the call location and under parentheses, the JSScript pointer and the jsbytecode pointer (pc) executed.
$ gdb --args js
[…]
(gdb) b js::ReportOverRecursed
(gdb) r
js> function f(i) {
  if (i % 2) f(i + 1);
  else f(i + 3);
}
js> f(0)

Breakpoint 1, js::ReportOverRecursed (maybecx=0xfdca70) at /home/nicolas/mozilla/ionmonkey/js/src/jscntxt.cpp:495
495         if (maybecx)
(gdb) call js::DumpBacktrace(maybecx)
#0          (nil)   typein:2 (0x7fffef1231c0 @ 0)
#1          (nil)   typein:2 (0x7fffef1231c0 @ 24)
#2          (nil)   typein:3 (0x7fffef1231c0 @ 47)
#3          (nil)   typein:2 (0x7fffef1231c0 @ 24)
#4          (nil)   typein:3 (0x7fffef1231c0 @ 47)
[…]
#25157 0x7fffefbbc250   typein:2 (0x7fffef1231c0 @ 24)
#25158 0x7fffefbbc1c8   typein:3 (0x7fffef1231c0 @ 47)
#25159 0x7fffefbbc140   typein:2 (0x7fffef1231c0 @ 24)
#25160 0x7fffefbbc0b8   typein:3 (0x7fffef1231c0 @ 47)
#25161 0x7fffefbbc030   typein:5 (0x7fffef123280 @ 9)
Note, you can do the exact same exercise above using lldb (necessary on OSX after Apple removed gdb) by running lldb -f js then following the remaining steps.
Since SpiderMonkey 48, we have a gdb unwinder. This unwinder is able to read the frames created by the JIT, and to display the frames which are after these JIT frames.
$ gdb --args out/dist/bin/js ./foo.js […] SpiderMonkey unwinder is disabled by default, to enable it type: enable unwinder .* SpiderMonkey (gdb) b js::math_cos (gdb) run […] #0 js::math_cos (cx=0x14f2640, argc=1, vp=0x7fffffff6a88) at js/src/jsmath.cpp:338 338 CallArgs args = CallArgsFromVp(argc, vp); (gdb) enable unwinder .* SpiderMonkey (gdb) backtrace 10 #0 0x0000000000f89979 in js::math_cos(JSContext*, unsigned int, JS::Value*) (cx=0x14f2640, argc=1, vp=0x7fffffff6a88) at js/src/jsmath.cpp:338 #1 0x0000000000ca9c6e in js::CallJSNative(JSContext*, bool (*)(JSContext*, unsigned int, JS::Value*), JS::CallArgs const&) (cx=0x14f2640, native=0xf89960 , args=...) at js/src/jscntxtinlines.h:235 #2 0x0000000000c87625 in js::Invoke(JSContext*, JS::CallArgs const&, js::MaybeConstruct) (cx=0x14f2640, args=..., construct=js::NO_CONSTRUCT) at js/src/vm/Interpreter.cpp:476 #3 0x000000000069bdcf in js::jit::DoCallFallback(JSContext*, js::jit::BaselineFrame*, js::jit::ICCall_Fallback*, uint32_t, JS::Value*, JS::MutableHandleValue) (cx=0x14f2640, frame=0x7fffffff6ad8, stub_=0x1798838, argc=1, vp=0x7fffffff6a88, res=JSVAL_VOID) at js/src/jit/BaselineIC.cpp:6113 #4 0x00007ffff7f41395 in<<JitFrame_Exit>>() #5 0x00007ffff7f42223 in<<JitFrame_BaselineStub>>() #6 0x00007ffff7f4423d in<<JitFrame_BaselineJS>>() #7 0x00007ffff7f4222e in<<JitFrame_BaselineStub>>() #8 0x00007ffff7f4326a in<<JitFrame_BaselineJS>>() #9 0x00007ffff7f38d5f in<<JitFrame_Entry>>() #10 0x00000000006a86de in EnterBaseline(JSContext*, js::jit::EnterJitData&) (cx=0x14f2640, data=...) at js/src/jit/BaselineJIT.cpp:150
Note, when you enable the unwinder, the current version of gdb (7.10.1) does not flush the backtrace. Therefore, the JIT frames do not appear until you settle on the next breakpoint. To work-around this issue you can use the recording feature of gdb, to step one instruction, and settle back to where you came from with the following set of gdb commands:
(gdb) record full
(gdb) si
(gdb) record goto 0
(gdb) record stop
If you have a core file, you can use the gdb unwinder the same way, or do everything from the command line as follow:
$ gdb -ex 'enable unwinder .* SpiderMonkey' -ex 'bt 0' -ex 'thread apply all backtrace' -ex 'quit' out/dist/bin/js corefile
The gdb unwinder is supposed to be loaded by dist/bin/js-gdb.py and load python scripts which are located in js/src/gdb/mozilla under gdb. If gdb does not load the unwinder by default, you can force it to, by using the source command with the js-gdb.py file.
Setting a breakpoint in the generated code (from gdb, x86 / x86-64, arm)
To set a breakpoint the generated code of a specific JSScript compiled with IonMonkey. Set a breakpoint on the instruction you are interested in. If you have no precise idea which function you are looking at, you can set a breakpoint on the js::ion::CodeGenerator::visitStart function. Optionally, a condition on the ins->id() of the LIR instruction can be added to select precisely the instruction you are looking for. Once the breakpoint is on CodeGenerator function of the LIR instruction, add a command to generate a static breakpoint in the generated code.
$ gdb --args js
[…]
(gdb) b js::ion::CodeGenerator::visitStart
(gdb) command
>call masm.breakpoint()
>continue
>end
(gdb) r
js> function f(a, b) { return a + b; }
js> for (var  i = 0; i < 100000; i++) f(i, i + 1);

Breakpoint 1, js::ion::CodeGenerator::visitStart (this=0x101ed20, lir=0x10234e0)
    at /home/nicolas/mozilla/ionmonkey/js/src/ion/CodeGenerator.cpp:609
609     }

Program received signal SIGTRAP, Trace/breakpoint trap.
0x00007ffff7fb165a in ?? ()
(gdb)
Once you hit the generated breakpoint, you can replace it by a gdb breakpoint to make it conditional, the procedure is to first replace the generated breakpoint by a nop instruction, and to set a breakpoint at the address of the nop.
(gdb) x /5i $pc - 1
   0x7ffff7fb1659:      int3
=> 0x7ffff7fb165a:      mov    0x28(%rsp),%rax
   0x7ffff7fb165f:      mov    %eax,%ecx
   0x7ffff7fb1661:      mov    0x30(%rsp),%rdx
   0x7ffff7fb1666:      mov    %edx,%ebx

(gdb) # replace the int3 by a nop
(gdb) set *(unsigned char *) ($pc - 1) = 0x90
(gdb) x /1i $pc - 1
   0x7ffff7fb1659:      nop

(gdb) # set a breakpoint at the previous location
(gdb) b *0x7ffff7fb1659
Breakpoint 2 at 0x7ffff7fb1659
Printing Ion generated assembly code (from gdb)
If you want to look at the assembly code generated by IonMonkey, you can follow this procedure:
- Place a breakpoint at CodeGenerator.cpp on the CodeGenerator::link method.
- Step next a few times, so that the "code" variable gets generated
- Print code->code_, which is the address of the code
- Disassembly code read at this address (using x/Ni address, where N is the number of instructions you would like to see)
Here is an example. It might be simpler to use the CodeGenerator::link lineno instead of the full qualified name to put the breakpoint. Let's say that the line number of this function is 4780, for instance:
(gdb) b CodeGenerator.cpp:4780
Breakpoint 1 at 0x84cade0: file /home/code/mozilla-central/js/src/ion/CodeGenerator.cpp, line 4780.
(gdb) r
Starting program: /home/code/mozilla-central/js/src/32-release/js -f /home/code/jaeger.js
[Thread debugging using libthread_db enabled]
Using host libthread_db library "/lib/x86_64-linux-gnu/libthread_db.so.1".
[New Thread 0xf7903b40 (LWP 12563)]
[New Thread 0xf6bdeb40 (LWP 12564)]
Run#0

Breakpoint 1, js::ion::CodeGenerator::link (this=0x86badf8)
    at /home/code/mozilla-central/js/src/ion/CodeGenerator.cpp:4780
4780    {
(gdb) n
4781        JSContext *cx = GetIonContext()->cx;
(gdb) n
4783        Linker linker(masm);
(gdb) n
4784        IonCode *code = linker.newCode(cx, JSC::ION_CODE);
(gdb) n
4785        if (!code)
(gdb) p code->code_
$1 = (uint8_t *) 0xf7fd25a8 "\201", <incomplete sequence \354\200>
(gdb) x/2i 0xf7fd25a8
   0xf7fd25a8:    sub    $0x80,%esp
   0xf7fd25ae:    mov    0x94(%esp),%ecx
On arm, the compiled JS code will always be ARM machine code, whereas spidermonkey itself is frequently Thumb2. Since there isn't debug info for the jitted code, you will need to tell gdb that you are looking at ARM code:
(gdb) set arm force-mode arm
Or you can wrap the x command in your own command:
def xi
    set arm force-mode arm
    eval "x/%di %d", $arg0, $arg1
    set arm force-mode auto
end
Printing asm.js/wasm generated assembly code (from gdb)
-
Set a breakpoint on
js::wasm::Instance::callExport(defined inWasmInstance.cppas of November 18th 2016). This will trigger for *any* asm.js/wasm call, so you should find a way to set this breakpoint for the only generated codes you want to look at. -
Run the program.
-
Do
nextin gdb until you reach the definition of thefuncPtr:
// Call the per-exported-function trampoline created by GenerateEntry.                                                                   │
auto funcPtr = JS_DATA_TO_FUNC_PTR(ExportFuncPtr, codeBase() + func.entryOffset());                                                      │
if (!CALL_GENERATED_2(funcPtr, exportArgs.begin(), &tlsData_))                                                                           │
    return false;
After it's set, x/64i funcPtrwill show you the trampoline code. There should be a call to an address at some point ; that's what we're targeting. Copy that address.
   0x7ffff7ff6000:    push   %r15
   0x7ffff7ff6002:    push   %r14
   0x7ffff7ff6004:    push   %r13
   0x7ffff7ff6006:    push   %r12
   0x7ffff7ff6008:    push   %rbp
   0x7ffff7ff6009:    push   %rbx
   0x7ffff7ff600a:    movabs $0xea4f80,%r10
   0x7ffff7ff6014:    mov    0x178(%r10),%r10
   0x7ffff7ff601b:    mov    %rsp,0x40(%r10)
   0x7ffff7ff601f:    mov    (%rsi),%r15
   0x7ffff7ff6022:    mov    %rdi,%r10
   0x7ffff7ff6025:    push   %r10
   0x7ffff7ff6027:    test   $0xf,%spl
   0x7ffff7ff602b:    je     0x7ffff7ff6032
   0x7ffff7ff6031:    int3
   0x7ffff7ff6032:    callq  0x7ffff7ff5000     <------ right here
x/64i address(in this case:x/64i 0x7ffff7ff6032).- If you want to put a breakpoint at the function's entry, you can do:
b *address(for instance here,b* 0x7ffff7ff6032). Then you can display the instructions around pc withx/20i $pc,and execute instruction by instruction withstepi.
Finding the script of Ion generated assembly (from gdb)
When facing a bug in which you are in the middle of IonMonkey generated code, first thing to note, is that gdb's backtrace is not reliable, because the generated code does not keep a frame pointer. To figure it out you have to read the stack to infer the IonMonkey frame.
(gdb) x /64a $sp
[…]
0x7fffffff9838: 0x7ffff7fad2da  0x141
0x7fffffff9848: 0x7fffef134d40  0x2
[…]
(gdb) p (*(JSFunction**) 0x7fffffff9848)->u.i.script_->lineno
$1 = 1
(gdb) p (*(JSFunction**) 0x7fffffff9848)->u.i.script_->filename
$2 = 0xff92d1 "typein"
The stack is order as defined in js/src/ion/IonFrames-x86-shared.h, it is composed of the return address, a descriptor (a small value), the JSFunction (if it is even) or a JSScript (if the it is odd, remove it to dereference the pointer) and the frame ends with the number of actual arguments (a small value too). If you want to know at which LIR the code is failing at, the js::ion::CodeGenerator::generateBody function can be intrumented to dump the LIR id before each instruction.
for (; iter != current->end(); iter++) { IonSpew(IonSpew_Codegen, "instruction %s", iter->opName()); […] masm.store16(Imm32(iter->id()), Address(StackPointer, -8)); // added if (!iter->accept(this)) return false;[…]}
This modification will add an instruction which abuse the stack pointer to store an immediate value (the LIR id) to a location which would never be generated by any sane compiler. Thus when dumping the assembly under gdb, this kind of instructions would be easily noticeable.
Viewing the MIRGraph of Ion/Odin compilations (from gdb)
With gdb instrumentation, we can call iongraph program within gdb when the execution is stopped. This instrumentation adds an iongraph command when provided with an instance of a MIRGenerator*, will call iongraph, graphviz and your prefered png viewer to display the MIR graph at the precise time of the execution. To find MIRGenetator* instances, is best is to look up into the stack for OptimizeMIR, or CodeGenerator::generateBody. OptimizeMIR function has a mir argument, and the CodeGenerator::generateBody function has a member this->gen.
(gdb) bt#0 0x00000000007eaad4 in js::InlineList<js::jit::MBasicBlock>::begin() const (this=0x33dbbc0) at …/js/src/jit/InlineList.h:280 #1 0x00000000007cb845 in js::jit::MIRGraph::begin() (this=0x33dbbc0) at …/js/src/jit/MIRGraph.h:787 #2 0x0000000000837d25 in js::jit::BuildPhiReverseMapping(js::jit::MIRGraph&) (graph=...) at …/js/src/jit/IonAnalysis.cpp:2436 #3 0x000000000083317f in js::jit::OptimizeMIR(js::jit::MIRGenerator*) (mir=0x33dbdf0) at …/js/src/jit/Ion.cpp:1570 … (gdb) frame 3 #3 0x000000000083317f in js::jit::OptimizeMIR(js::jit::MIRGenerator*) (mir=0x33dbdf0) at …/js/src/jit/Ion.cpp:1570(gdb) iongraph mirfunction 0 (asm.js compilation): success; 1 passes./* open your png viewer with the result of iongraph */
This gdb instrumentation is supposed to work with debug builds, or with optimized build compiled with --enable-jitspew configure flag. External programs such as iongraph, dot, and your png viewer are search into the PATH, otherwise custom one can either be configured with environment variables (GDB_IONGRAPH, GDB_DOT, GDB_PNGVIEWER) before starting gdb, or with gdb parameters (set iongraph-bin <path>, set dot-bin <path>, set pngviewer-bin <path>) within gdb.
Enabling GDB instrumentation may require launching a JS shell executable that shares a directory with a file name "js-gdb.py". If js/src/js does not provide the "iongraph" command, try js/src/shell/js. GDB may complain that ~/.gdbinit requires modification to authorize user scripts, and if so will print out directions.
Break on valgrind errors
Sometimes, a bug can be reproduced under valgrind but hardly under gdb. One way to investigate is to let valgrind start gdb for you, the other way documented here is to let valgrind act as a gdb server which can be manipulated from the gdb remote.
$ valgrind --smc-check=all-non-file--vex-iropt-register-updates=allregs-at-mem-access--vgdb-error=0 ./js …
This command will tell you how to start gdb as a remote. Be aware that functions which are usually dumping some output will do it in the shell where valgrind is started and not in the shell where gdb is started. Thus functions such as js::DumpBacktrace, when called from gdb, will print their output in the shell containing valgrind.
Adding spew for Compilations & Bailouts & Invalidations (from gdb)
If you are in rr, and forgot to record with the spew enabled with IONFLAGS or because this is an optimized build, then you can add similar spew with extra breakpoints within gdb. gdb has the ability to set breakpoints with commands, but a simpler / friendlier version is to use dprintf, with a location, and followed by printf-like arguments.
(gdb) dprintf js::jit::IonBuilder::IonBuilder, "Compiling %s:%d:%d-%d\n", info->script_->scriptSource()->filename_.mTuple.mFirstA, info->script_->lineno_, info->script_->sourceStart_, info->script_->sourceEnd_
Dprintf 1 at 0x7fb4f6a104eb: file /home/nicolas/mozilla/contrib-push/js/src/jit/IonBuilder.cpp, line 159.
(gdb) cond 1 inliningDepth == 0
(gdb) dprintf js::jit::BailoutIonToBaseline, "Bailout from %s:%d:%d-%d\n", iter.script()->scriptSource()->filename_.mTuple.mFirstA, iter.script()->lineno_, iter.script()->sourceStart_, iter.script()->sourceEnd_
Dprintf 2 at 0x7fb4f6fe43dc: js::jit::BailoutIonToBaseline. (2 locations)
(gdb) dprintf Ion.cpp:3196, "Invalidate %s:%d:%d-%d\n", co->script_->scriptSource()->filename_.mTuple.mFirstA, co->script_->lineno_, co->script_->sourceStart_, co->script_->sourceEnd_
Dprintf 3 at 0x7fb4f6a0b62a: file /home/nicolas/mozilla/contrib-push/js/src/jit/Ion.cpp, line 3196.
(gdb) continue
Compiling self-hosted:650:20470-21501
Bailout from self-hosted:20:403-500
Invalidate self-hosted:20:403-500
Note: the line 3196, listed above, corresponds to the location of the Jit spew inside jit::Invalidate function.
Hacking tips
Benchmarking (shell)
AreWeFastYet.com display the benchmark results of the JavaScript shell, and browser for B2G. These benchmarks are publicly recognized benchmarks suggested by other companies and are used as a metric to evaluate how fast JavaScript engines. This tool is maintained by the JavaScript Team, to find regressions and to compare SpiderMonkey with other JavaScript engines when possible. To run these benchmarks localy, you can clone AreWeFastYet sources and look inside the benchmarks directory to run individual benchmarks with your JS shell.
Using the Gecko Profiler (browser / xpcshell)
see the section dedicated to profiling with the gecko profiler. This method of profiling has the advantage of mixing the JavaScript stack with the C++ stack, which is useful to analyze library function issues. One tip is to start looking at a script with an inverted JS stack to locate the most expensive JS function, then to focus on the frame of this JS function, and to remove the inverted stack and look at C++ part of this function to determine from where the cost is coming from.
Using the JIT Inspector (browser)
Install the JIT Inspector addon in your browser. This addon provides estimated cost of IonMonkey , the Baseline compiler, and the interpreter. In addition it provides a clean way to analyze if instructions are inferred as being monomorphic or polymorphic in addition to the number of time each category of type has been observed.
Using the TraceLogger (JS shell / browser)
Create graphs showing time spent in which engine and which function like this.
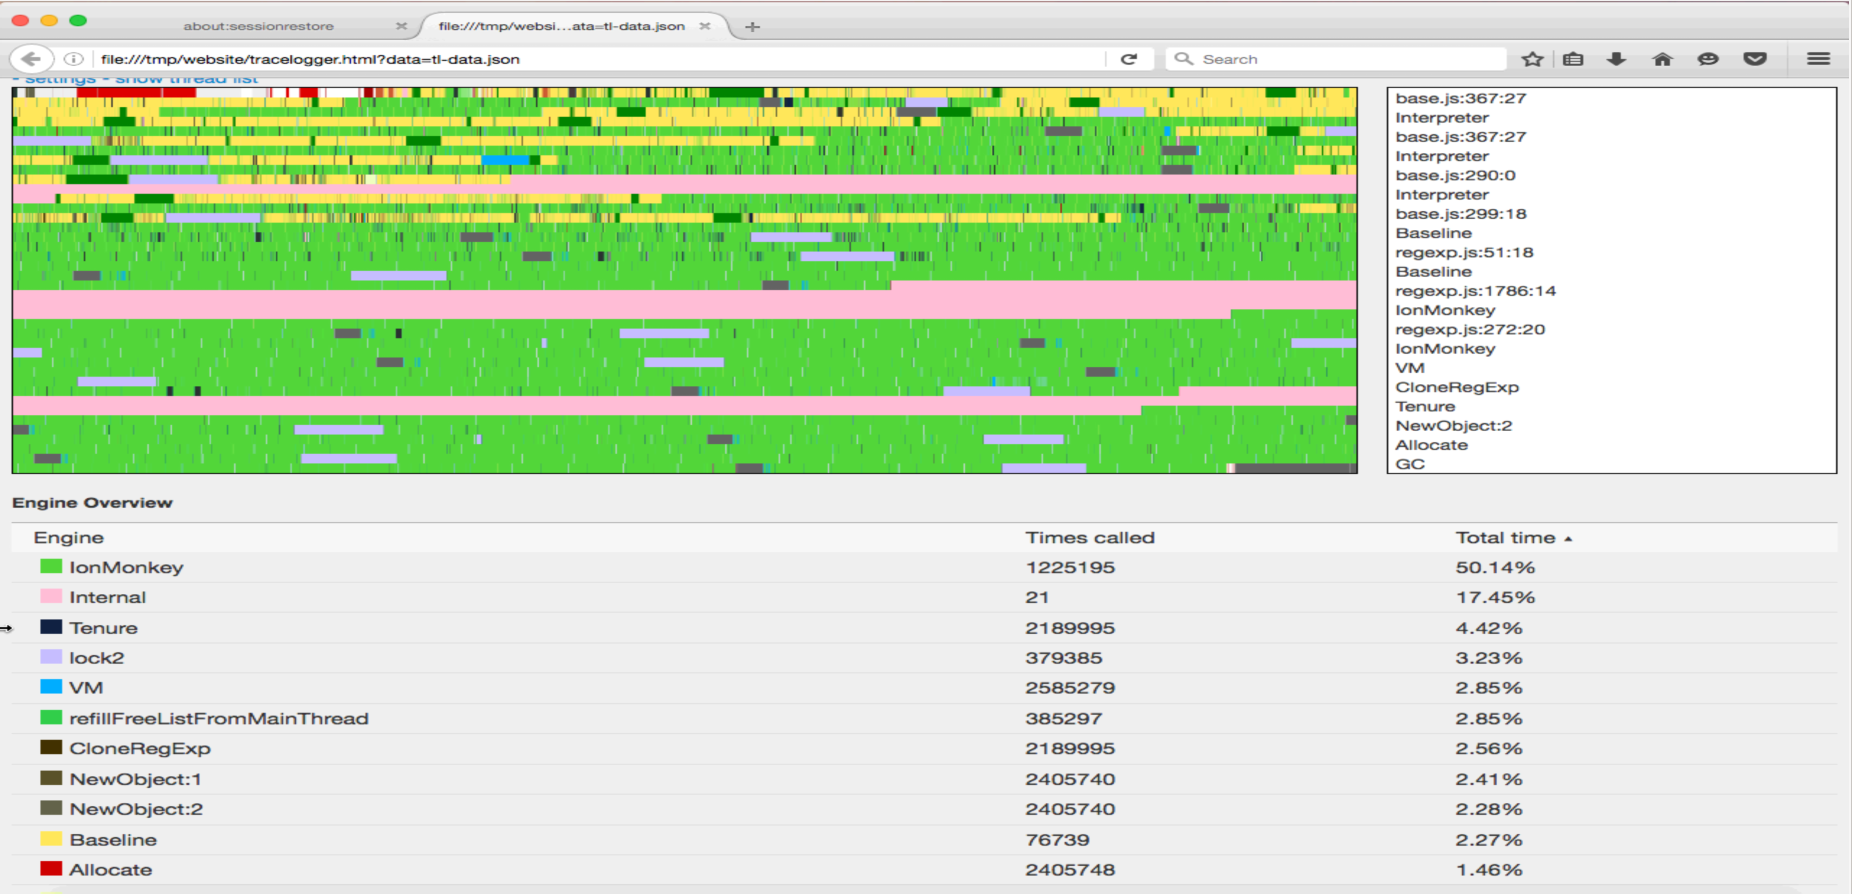
Whenever running a testcase the file "tl-data.json" and several "tl-*" files get created in the "/tmp" directory. (Per proces a "tl-data-*PID*.json" file and per thread a "tl-tree.*PID*.*ID*.tl", "tl-event.*PID*.*ID*.tl" and "tl-dict.*PID*.*ID*.json" file). These files contain all information to create a tracelogger graph. On https://github.com/h4writer/tracelogger you can find the instructions to create the graph (Tools V2 > 1. Creating a tracelogging graph).
Note 1: when you are doing this from "file:///" you will probably get a security warning in the console. This is because firefox doesn't allow loading files from the harddisk using httprequest, even when the file loading the file is on the harddisk. There are two solutions. One is to create a localhost server and serving the files there. The simplest way to do this is to run python -m SimpleHTTPServer from within the above directory. The other being disable this check in "about:config", by temporarily switching "security.fileuri.strict_origin_policy" to false
Note 2: The files can be very big and take a long time to load in the browser. Therefore it might be good to reduce the logged file. This will remove entries that took only a minor time (=entries that will only show up with les than 1px). This can be done with the reduce.py script in https://github.com/haytjes/tracelogger/tree/master/tools_v2. You need to download "engine.js", "reduce.py", "reduce.js", "reduce-tree.js" and "reduce-corrections.js". Running this tool is a matter of running "python reduce.py JS_SHELL /tmp/tl-data.json tl-reduced". Where JS_SHELL is a real shell.
Using callgrind (JS shell)
As SpiderMonkey just-in-time compiler are rewriting the executed program, valgrind should be informed from the command line by adding --smc-check=all-non-file.
$ valgrind --tool=callgrind --callgrind-out-file=bench.clg \ --smc-check=all-non-file--vex-iropt-register-updates=allregs-at-mem-access./js ./run.js
The output file can then be use with kcachegrind which provides a graphical view of the call graph.
Using IonMonkey spew (JS shell)
IonMonkey spew is extremely verbose (not as much as the INFER spew), but you can filter it to focus on the list of compiled scripts or channels, IonMonkey spew channels can be selected with the IONFLAGS environment variable, and compilation spew can be filtered with IONFILTER.
IONFLAGS contains the names of each channel separated by commas. The logs channel produces 2 files in /tmp/, one (/tmp/ion.json) made to be used with iongraph (made by Sean Stangl) and another one (/tmp/ion.cfg) made to be used with c1visualizer. These tools will show the MIR & LIR steps done by IonMonkey during the compilation. If you would like to use iongraph, you must install Graphviz.
Compilation logs and spew can be filtered with the IONFILTER environment variable which contains locations as output in other spew channels. Multiple locations can be separated with comma as a separator of locations.
$ IONFILTER=pdfjs.js:16934 IONFLAGS=logs,scripts,osi,bailouts ./js --ion-offthread-compile=off ./run.js 2>&1 | lessThe bailouts channel is likely to be the first thing you should focus on, because this means that something does not stay in IonMonkey and fallback to the interpreter. This channel output locations (as returned by the id() function of both instructions) of the latest MIR and the latest LIR phases. These locations should correspond to phases of the logs and a filter can be used to remove uninteresting functions.
Using the ARM simulator
The ARM simulator can be used to test the ARM JIT backend on x86/x64 hardware. An ARM simulator build is an x86 shell (or browser) with the ARM JIT backend. Instead of entering JIT code, it runs it in a simulator (interpreter) for ARM code. To use the simulator, compile an x86 shell (32-bit, x64 doesn't work as we use a different Value format there), and pass --enable-arm-simulator to configure. For instance, on a 64-bit Linux host you can use the following configure command to get an ARM simulator build:
AR=ar CC="gcc -m32" CXX="g++ -m32" ../configure --target=i686-pc-linux --enable-debug --disable-optimize --enable-threadsafe --enable-simulator=armOr on OS X:
$ AR=ar CC="clang -m32" CXX="clang++ -m32" ../configure --target=i686-apple-darwin10.0.0 --enable-debug --disable-optimize --enable-threadsafe --enable-arm-simulator
An --enable-debug --enable-optimize build is recommended if you want to run jit-tests or jstests.
Use the VIXL Debugger in the simulator (arm64)
Set a breakpoint (see the comments above about masm.breakpoint()) and run with the environment variable USE_DEBUGGER=1. This will then drop you into a simple debugger provided with VIXL, the ARM simulator technology used for arm64 simulation.
Use the Simulator Debugger for arm32
The same instructions for arm64 in the preceeding section apply, but the environment variable differs: Use ARM_SIM_DEBUGGER=1.
Building the browser with the ARM simulator
You can also build the entire browser with the ARM simulator backend, for instance to reproduce browser-only JS failures on ARM. Make sure to build a browser for x86 (32-bits) and add this option to your mozconfig file:
ac_add_options --enable-arm-simulator
If you are under an Ubuntu or Debian 64-bits distribution and you want to build a 32-bits browser, it might be hard to find the relevant 32-bits dependencies. You can use padenot's scripts which will magically setup a chrooted 32-bits environment and do All The Things (c) for you (you just need to modify the mozconfig file).
Using rr on a test
Get the command line for your test run using -s:
./jit_test.py -s $JS_SHELL saved-stacks/async.js
Insert 'rr' before the shell invocation:
rr $JS_SHELL -f $JS_SRC/jit-test/lib/prolog.js --js-cache $JS_SRC/jit-test/.js-cache -e "const platform='linux2'; const libdir='$JS_SRC/jit-test/lib/'; const scriptdir='$JS_SRC/jit-test/tests/saved-stacks/'" -f $JS_SRC/jit-test/tests/saved-stacks/async.js(note that the above is an example; simply setting JS_SHELL and JS_SRC will not work). Or if this is an intermittent, run it in a loop capturing an rr log for every one until it fails:
n=1; while rr ...same.as.above...; do echo passed $n; n=$(( $n + 1 )); doneWait until it hits a failure. Now you can run rr replay to replay that last (failed) run under gdb.
rr with reftest
To break on the write of a differing pixel:
- Find the X/Y of a pixel that differs
- Use 'run Z' where Z is the mark in the log for TEST-START. For example in '[rr 28496 607198]REFTEST TEST-START | file:///home/bgirard/mozilla-central/tree/image/test/reftest/bmp/bmpsuite/b/wrapper.html?badpalettesize.bmp' Z would be 607198.
- break 'mozilla::dom::CanvasRenderingContext2D::DrawWindow(nsGlobalWindow&, double, double, double, double, nsAString_internal const&, unsigned int, mozilla::ErrorResult&)'
- cont
- break 'PresShell::RenderDocument(nsRect const&, unsigned int, unsigned int, gfxContext*)'
- set print object on
- set $x = <YOUR X VALUE>
- set $y = <YOUR Y VALUE>
- print &((cairo_image_surface_t*)aThebesContext->mDT.mRawPtr->mSurface).data[$y * ((cairo_image_surface_t*)aThebesContext->mDT.mRawPtr->mSurface).stride + $x * ((cairo_image_surface_t*)aThebesContext->mDT.mRawPtr->mSurface).depth / 8]
-
watch *(char*)<ADDRESS OF PREVIOUS COMMAND> (NOTE: If you set a watch on the previous expression gdb will watch the expression and run out of watchpoint)
rr with emacs
Within emacs, do M-x gud-gdb and replace the command line with rr replay. When gdb comes up, enter
set annot 1to get it to emit file location information so that emacs will pop up the corresponding source. Note that if you reverse-continue over a SIGSEGV and you're using the standard .gdbinit that sets a catchpoint for that signal, you'll get an additional stop at the catchpoint. Just reverse-continue again to continue to your breakpoints or whatever.
[Hack] Replacing one instruction
To replace one specific instruction, you can use in visit function of each instruction the JSScript filename in lineno fields as well as the id() of the LIR / MIR instructions. The JSScript can be obtained from info().script().
bool
CodeGeneratorX86Shared::visitGuardShape(LGuardShape *guard)
{
    if (info().script()->lineno == 16934 && guard->id() == 522) {
        [… another impl only for this one …]
        return true;
    }
    [… old impl …]
[Hack] Spewing all compiled code
I usually just add this to the apropriate executableCopy.
    if (getenv("INST_DUMP")) {
        char buf[4096];
        sprintf(buf, "gdb /proc/%d/exe %d -batch -ex 'set pagination off' -ex 'set arm force-mode arm' -ex 'x/%di %p' -ex 'set arm force-mode auto'", getpid(), getpid(), m_buffer.size() / 4, buffer);
        system(buf);
    }
If you aren't running on arm, you should omit the -ex 'set arm force-mode arm' and -ex 'set arm force-mode auto'. And you should change the size()/4 to be something more apropriate for your architecture.
Benchmarking with sub-milliseconds (JS shell)
In the shell we have 2 simple ways to benchmark a script, we can either use the -b shell option (--print-timing) which will evaluate a script given on the command line without any need to instrument the benchmark and print an extra line showing the run-time of the script. The other way is to wrap the section that you want to measure with the dateNow() function call which returns the number of milliseconds, with a decimal part for sub-milliseconds.
js> dateNow() - dateNow()
-0.0009765625
Benchmarking with sub-milliseconds (browser)
In a simillar way as dateNow() in the JS shell, you can use performance.now() in the JavaScript code of a page.
Dumping the JavaScript heap
From the shell, you can call the dumpHeap before Firefox function to dump out all GC things (reachable and unreachable) that are present in the heap. By default the function writes to stdout, but a filename can be specified as an argument.
Example output might look as follows:
0x1234abcd B global object========== # zone 0x56789123 # compartment http://gmail.com [in zone 0x56789123] # compartment http://gmail.com/iframe [in zone 0x56789123] # arenaallockind=3 size=64 0x1234abcd B object > 0x1234abcd B prop1 > 0xabcd1234 W prop2 0xabcd1234 W object > 0xdeadbeef B prop3 # arena allockind=5 size=72 0xdeadbeef W object > 0xabcd1234 W prop4
The output is textual. The first section of the file contains a list of roots, one per line. Each root has the form "0xabcd1234 <color> <description>", where <color> is the color of the given GC thing (B for black, G for gray, W for white) and <description> is a string. The list of roots ends with a line containing "==========".
After the roots come a series of zones. A zone starts with several "comment lines" that start with hashes. The first comment declares the zone. It is followed by lines listing each compartment within the zone. After all the compartments come arenas, which is where the GC things are actually stored. Each arena is followed by all the GC things in the arena. A GC thing starts with a line giving its address, its color, and the thing kind (object, function, whatever). After this come a list of addresses that the GC thing points to, each one starting with ">".
It's also possible to dump the JavaScript heap from C++ code (or from gdb) using the js::DumpHeap function. It is part of jsfriendapi.h and it is available in release builds.
Inspecting MIR objects within a debugger
For MIRGraph, MBasicBlock, and MDefinition and its subclasses (MInstruction, MConstant, etc.), call the dump member function.
  (gdb) call graph->dump()

  (gdb) call block->dump()

  (gdb) call def->dump()
Benchmarking without a Phone
If you do not have a mobile device or prefer to test on your desktop first, you will need to downgrade your computer such as it is able to run programs as fast as-if they were running on a phone.
On Linux, you can manage the resources available to one program by using cgroup, and to do you can install libcgroup which provides some convenient tools such as cgexec to wrap the program that you want to benchmark.
The following list of commands is used to create 3 control groups. The top-level control group is just to group the mask and the negate-mask. The mask control group is used to run the program that we want to benchmark. The negate-mask control group is used to reserve resources which might be used by the other program if not reserved.
  $ sudo cgcreate -a nicolas:users -t nicolas:users -g cpuset,cpu,memory:/benchmarks
  $ cgcreate -a nicolas:users -t nicolas:users -g cpuset,cpu,memory:/benchmarks/mask
  $ cgcreate -a nicolas:users -t nicolas:users -g cpuset,cpu,memory:/benchmarks/negate-mask
Then we restrict programs of these groups to the first core of the CPU. This is a list of cpu, which means that we can allocate 2 cores by doing 0-1 instead of 0.
  $ cgset -r cpuset.cpus=0 /benchmarks
  $ cgset -r cpuset.cpus=0 /benchmarks/mask
  $ cgset -r cpuset.cpus=0 /benchmarks/negate-mask
Then we restrict programs of these groups to the first memory node. Most of the time you will only have one, otherwise you should read what is the best setting to set here. If this is not set, you will have some error when you will try to write a pid in /sys/fs/cgroup/cpuset/benchmarks/mask/tasks while running cgexec.
  $ cgset -r cpuset.mems=0 /benchmarks
  $ cgset -r cpuset.mems=0 /benchmarks/mask
  $ cgset -r cpuset.mems=0 /benchmarks/negate-mask
Then we limit the performance of the CPU, as a proportion such as the result approximately correspond to what you might have if you were running on a phone. For example an Unagi is approximately 40 times slower than my computer. So I allocate 1/40 for the mask, and 39/40 for the negate-mask.
  $ cgset -r cpu.shares=1 /benchmarks/mask
  $ cgset -r cpu.shares=39 /benchmarks/negate-mask
Then we limit the memory available, to what would be available on the phone. For example an Unagi you want to limit this to 512 MB. As there is no swap, on this device, we set the memsw (Memory+Swap) to the same value.
  $ cgset -r memory.limit_in_bytes=$((512*1024*1024)) /benchmarks/mask
  $ cgset -r memory.memsw.limit_in_bytes=$((512*1024*1024)) /benchmarks/mask
And finally, we run the program that we want to benchmark after the one which is consuming resources. In case of the JS Shell we might also want to set the amount of memory available to change the GC settings as if we were running on a Firefox OS device.
  $ cgexec -g 'cpuset,cpu,memory:/benchmarks/negate-mask' yes > /dev/null &
  $ cgexec -g 'cpuset,cpu,memory:/benchmarks/mask' ./js --available-memory=512 ./run.js
How to debug oomTest() failures
The oomTest() function executes a piece of code many times, simulating an OOM failure at each successive allocation it makes. It's designed to highlight incorrect OOM handling and this may show up as a crash or assertion failure at some later point.
When debugging such a crash the most useful thing is to locate the last simulated alloction failure, as it's usually this that has caused the subsequent crash.
My workflow for doing this is as follows:
- Build a version of the engine with
--enable-debugand--enable-oom-breakpointconfigure flags. - Set the environment variable
OOM_VERBOSE=1and reproduce the failure. This will print an allocation count at each simulated failure. Note the count of the last allocation. - Run the engine under a debugger and set a breakpoint on the function
js_failedAllocBreakpoint. - Run the program and continue the necessary number of times until you reach the final allocation.
- e.g. in lldb, if the allocation failure number shown is 1500, run `continue -i 1498` (subtracted 2 because we've already hit it once and don't want to skip the last). Drop "-i" for gdb.
- Dump a backtrace. This should show you the point at which the OOM is incorrectly handled, which will be a few frames up from the breakpoint.
Note: if you are on linux it may be simpler to use rr.
Some guidelines for handling OOM that lead to failures when they are not followed:
- Check for allocation failure!
- Fallible allocations should always must be checked and handled, at a minimum by returning a status indicating failure to the caller.
- Report OOM to the context if you have one
- If a function has a
JSContext*argument, usually it should calljs::ReportOutOfMemory(cx)on allocation failure to report this to the context.
- If a function has a
- Sometimes it's OK to ignore OOM
- For example if you are performing a speculative optimisation you might abandon it and continue anyway. But in this case you may have to call cx->recoverFromOutOfMemory() if something further down the stack has already reported the failure.
Debugging GC marking/rooting
The js::debug namespace contains some functions that are useful for watching mark bits for an individual JSObject* (or any Cell*). js/src/gc/Heap.h contains a comment describing an example usage. Reproduced here:
// Sample usage from gdb:
//
//   (gdb) p $word = js::debug::GetMarkWordAddress(obj)
//   $1 = (uintptr_t *) 0x7fa56d5fe360
//   (gdb) p/x $mask = js::debug::GetMarkMask(obj, js::gc::GRAY)
//   $2 = 0x200000000
//   (gdb) watch *$word
//   Hardware watchpoint 7: *$word
//   (gdb) cond 7 *$word & $mask
//   (gdb) cont
//
// Note that this is *not* a watchpoint on a single bit. It is a watchpoint on
// the whole word, which will trigger whenever the word changes and the
// selected bit is set after the change.
//
// So if the bit changing is the desired one, this is exactly what you want.
// But if a different bit changes (either set or cleared), you may still stop
// execution if the $mask bit happened to already be set. gdb does not expose
// enough information to restrict the watchpoint to just a single bit.
Most of the time, you will want js::gc::BLACK (or you can just use 0) for the 2nd param to js::debug::GetMarkMask.