
The Firefox Profiler is a profiler that is built into Firefox and is available at profiler.firefox.com. It has tighter integration with Firefox than external profilers, and has more of a platform focus than the DevTools performance panel. It can be used in a variety of situations where external profilers are not available, and can provide more information and insight into what the browser is doing.
Using the Firefox Profiler
Visit profiler.firefox.com to get started. It has instructions for enabling the profiler menu button, and getting going. There are also product docs available at profiler.firefox.com/docs/. In addition to profiler.firefox.com, the Firefox DevTools have a simplified interface targeted towards web developers, but does not include as much information as the Firefox Profiler web app. It is available from the menu at Tools > Web Developer > Performance.
Understanding Profiles
The Firefox Profiler has more current documentation available at profiler.firefox.com/docs/. However the following could have some potentially useful information for Gecko-specific problems.
You can check out some frequently asked questions about the Firefox Profilers.
Reporting a Performance Problem has a step-by-step guide for obtaining a profile when requested by Firefox developers.
Interface
1. Timeline

The timeline has several rows of tracing markers (colored segments) which indicate interesting events. Hover over them to see more information. Below the tracing markers are rows corresponding with activity on a variety of threads.
Tip: Threads that are annotated with "[default]" are in the parent (aka "UI", aka "browser chrome", aka "main") process and those annotated with "[tab]" are in the Web content (aka "child") processes.
Tip: Long-running tasks in the parent process will block all input or drawing with the browser UI (aka "UI jank") whereas long-running tasks in the content process will block interactivity with the page but still allowing the user to pan and zoom around thanks to APZ.
Tracing markers
- Red: These indicate that the event loop is being unresponsive. Note that high priority events such as vsync are not included here. Also note that this indicates what would have happened had there been an event waiting and not necessarily that there was an event pending for that long.
- Black: These indicate synchronous IPC calls.
Ranges
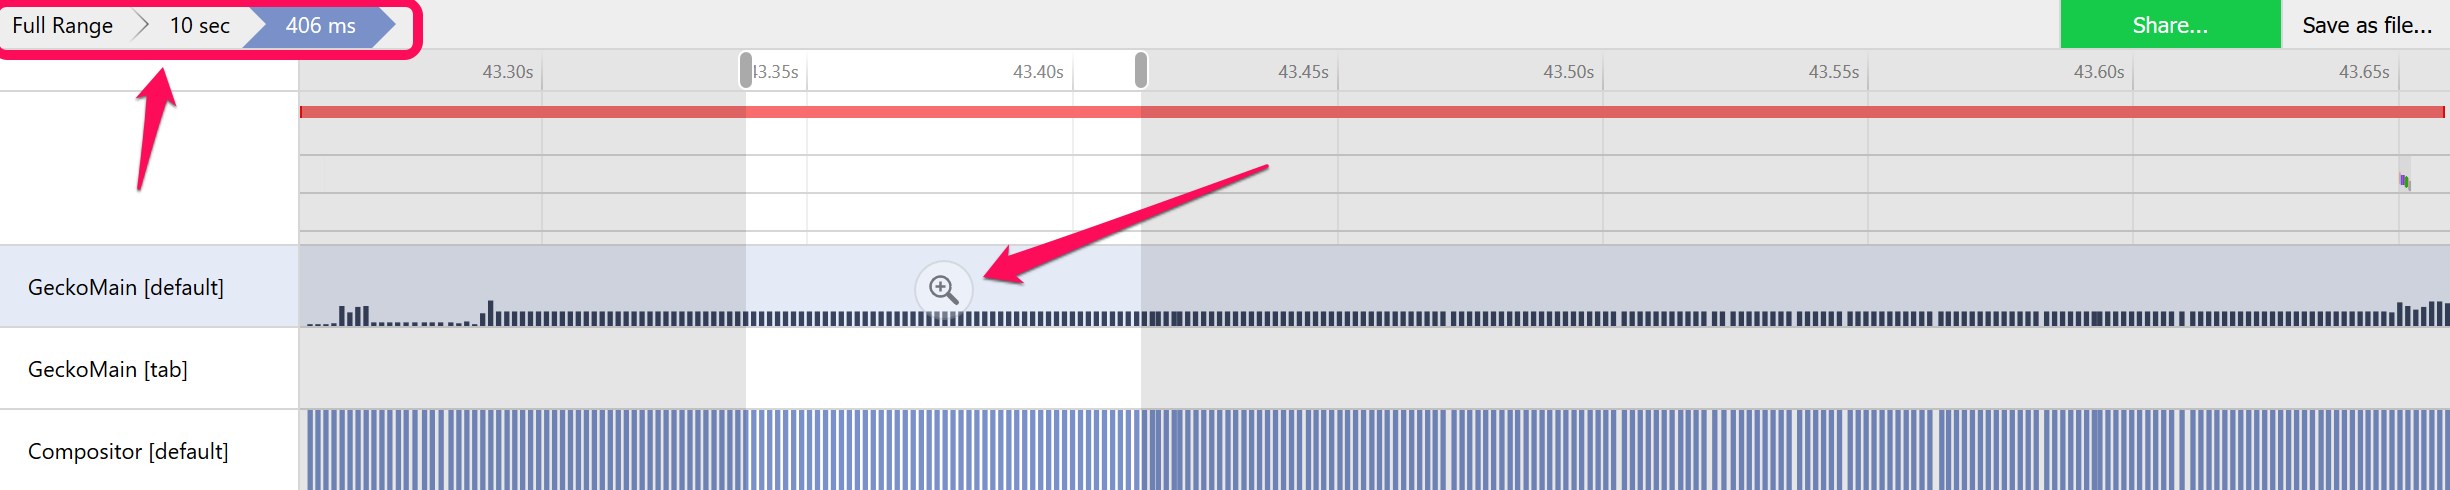
Ranges of time can be zoomed in on by clicking and dragging anywhere in the tracing marker or thread areas. Once a range is selected, a magnifying glass appears which zooms into that range. Clicking on a tracing marker will create a selection corresponding with its duration allowing for easy zooming in on interesting time ranges. As you zoom in on ranges, breadcrumbs are created allowing you to easily navigate back to previously-selected ranges or the entire profile (denoted as "Full Range").
Tip: While zooming out to a previously-selected range deletes the narrower range, the browser back button can be used to restore the narrower range.
Thread Timeline(s)
Thread/Process Timelines: Below the tracing markers we have a list of profiled threads. These threads may come from different processes. In this case, we have the 'GeckoMain [default]' process' main thread, a content process' main thread, and the main thread of the compositor process. Each of these timelines is aligned with wall clock time. So, for example, when a thread is blocked, like 'GeckoMain [tab]', on a thread like 'GeckoMain [default]', we can see what's occurring on the latter thread that is preventing it from responding to the former.
X (Time) axis: The timelines go from left to right as wall clock time increases along the X axis. Elements in the timeline are spaced at the sampling frequency with an attempt to align them with time. Factors such as sampling or stack-walking variance and system load can lead to sampling delays which manifest as gaps in the timeline.
Note: because this is a sampling profiler, be cautious when examining running time that is equal to the sampling interval. For very time-sensitive profiling, you may want to consider a non-sampling profiler.
Y (Stack) axis: The Y axis is the stack depth, not the CPU activity. The change in stack height is useful to find patterns like long blocking calls (long flatlines) or very tall spiky blocks (recursive calls and JS). With more experience you can read profiles faster by recognizing patterns. Also note that you can click on timeline elements (the selected element gets darker when selected) and the tree view (see below) reflects the selected element.
2. Call Tree
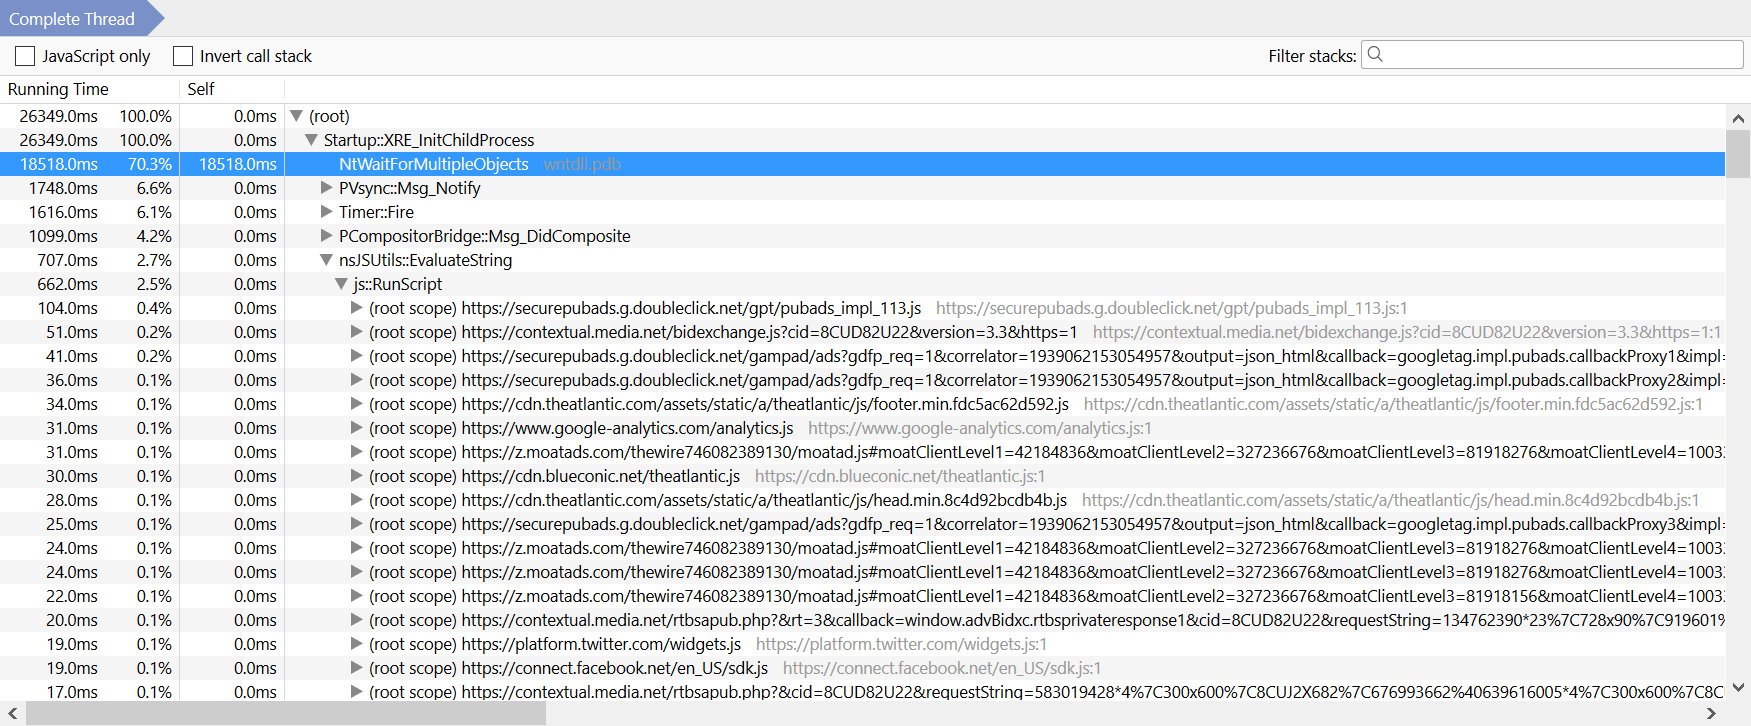
The Call Tree shows the samples organized by 'Running Time' which will show the data by wall clock time. There are lighter grey names to the right of tree elements that indicate where the code comes from. Be aware that elements can be from JavaScript, Gecko, or system libraries. Note that if some functions are not yet named properly, symbolication may not yet be finished.
Tip: You can right-click on a function name to get an option to copy its name to the clipboard.
A significant portion of time can be spent in idle, blocking calls like waiting for events. This is ideal for a responsive application to be ready to service incoming events. There are OS-specific waiting functions like NtWaitForMultipleObjects seen in the example above taken on Windows or mach_msg_trap on macOS.
Tip: You can quickly go deeper into the call tree by holding down your right arrow key. Alternatively, expand an entire tree segment by holding Alt and clicking on the arrow to the left of the collapsed tree segment.
As we progress into a more specific part of the tree, you'll notice that the 'Running time' decreases. This happens when a function has 2 or more non-trivial calls: the running time will be split between its children.
Tip: Focus on one section of the tree by clicking on the "arrow-in-a-circle" icon that appears to the right of the tree element as you hover over it. A "tree breadcrumb" will appear similar to the range breadcrumbs noted above.
Clicking the "JavaScript only" option will only show JavaScript code in the Call Tree. You could compare the time with this option checked and the total time to get an idea of how much time was spent running JS. Note that long-running JS function execution may not actually be taking as long as you think because further down the call stack there may be something like painting happening.
Clicking the "Invert call stack" option will sort by the time spent in a function in descending order. Note that the running time here is only the running time of that particular frame and not the total of all called instances of that function. You can see the samples in the Timeline get darker as you select different functions in the Call Tree; these are samples that were taken when the selected function was running.
"Filter stacks" will allow you to search for functions by name. One of the easiest ways to find slowness caused by a page's JS is to type its URL into the "Filter stacks" box. You can then select corresponding Call Tree entries and watch the Timeline for entries in the content process main thread that get darker as you select Call Tree entries.
Tip: If things are blank elsewhere in the UI, you may have text entered into the "Filter stacks" box.
Custom Annotations
In bug 1334218 an annotation was added to PresShell::Paint to show the URL of the document being painted. These annotations are not too complex to add so if you would like something added, file a bug.
3. Sharing the profile
Click "Publish...", some of the data may be excluded, click "Publish". If you select a different time range, the URL revealed by pressing "Permalink" will change so that you can be sure the recipient of the URL will see the same things you are seeing.
Tips
Understanding profiles can be difficult. If you're unfamiliar with Gecko's internals, you can click the JavaScript only button to see where your JavaScript code is slow. Each entry in the Call Tree shows a call stack and how much time is spent in that call stack. For example: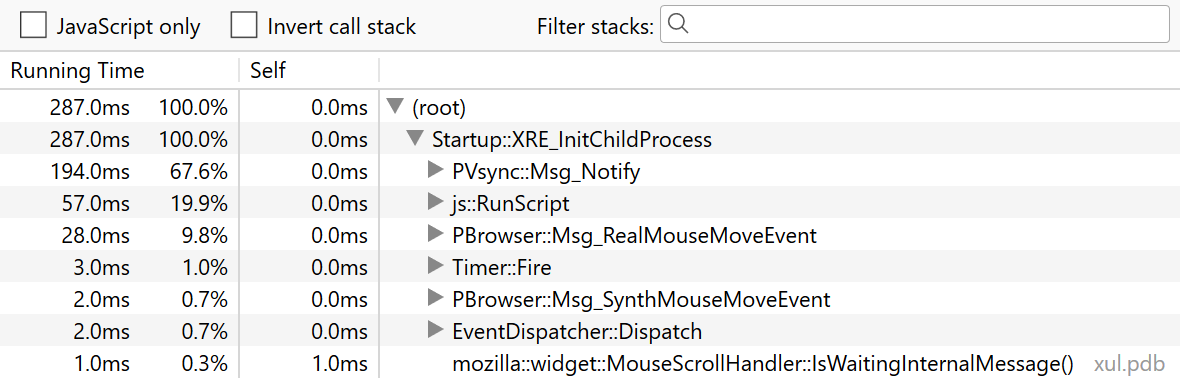 In the results above we can see that we're spending ~287 milliseconds in
 Startup::XRE_InitChildProcess, 194 ms of which are spent in PVsync::Msg_Notify and all child functions that it calls. It is useful to scan down the "Running Time" column and look for when the time changes. While looking for performance problems, you're looking for the processes that are taking the most time; then you can figure out how to optimize them.
Common Performance Bugs in Firefox
Inefficient code that is on the reflow or restyle paths is often to blame for jank. So is code that is run often in the parent process or in parts of the codebase that apply to many users.
Synchronous re-flow can be caused by JS that, for example, makes changes to the page content in a loop and queries about the layout of the page in that same loop.
A PresShell:Flush means that we are either recomputing styles or recomputing layout. These sorts of flushes should be avoided if possible, as they can be quite expensive. Keep your eyes out for flushes like this that are blocking the main thread for a long time. If you notice these things happening in a loop, that's a bug to be fixed, since we're likely "layout thrashing".
Some more tips and answers to common questions are available in a mid-2017 FAQ document.
It's a good idea to search bugzilla before filing a bug about a performance problem in Firefox but sometimes it's hard to find issues that have already been reported. Therefore, it's usually a good idea to file a bug.
Profiling local Windows builds
If you built Firefox for Windows locally and you would like to use the local symbols with the profiler, you will need to run an additional tool; see Profiling with the Firefox Profiler and Local Symbols on Windows.
Profiling Try builds
Profiling Try builds is supported, but to have symbols in the profiles, they need to be available on the symbol server.
Symbols for Try builds are not uploaded to the symbol server automatically, you need to trigger a "Sym" job on treeherder: Using treeherder's Add new jobs UI, schedule a "Sym" job for each platform whose "B" job you want symbols for. (And "SymN" if you have an "N" job you want symbols for, i.e. a build job with the "nightly configuration.)
Profiling Firefox mobile
Firefox 61 for Android supports Gecko profiler again; see Remote profiling on Android for details.
The following information is old version of Firefox for Android.
- For local builds of Fennec, you should build with optimization and
STRIP_FLAGS="--strip-debug"but NOT with--enable-profiling. Nightly builds are already built with the appropriate flags. - You'll need to have
adbandarm-eabi-addr2line(which is part of the Android NDK) in your bashPATH, so uselocate arm-eabi-addr2line(on Linux) ormdfind name:arm-eabi-addr2line(on OS X) and stick an export to its location in~/.bash_profile. The extension will invoke bash to useadbandaddr2line. - Install the latest pre-release build in your host machine's Firefox browser that has your phone reachable via ADB. This will add a icon in the top right of the browser.
- Set
devtools.debugger.remote-enabledtotrueinabout:configfor Fennec. - Select target Mobile USB and press Connect. The first run will take an additional 1 minute or so to pull in the required system libraries.
Profiling Firefox Startup
- Start your Firefox with the environment variable
MOZ_PROFILER_STARTUP=1set. This way the profiler is started as early as possible during startup. - Then capture the profile using the add-on as usual.
Startup profiling does not use the settings that you configured in the add-on's panel. It uses settings that can be configured with the environment variables MOZ_PROFILER_STARTUP_ENTRIES, MOZ_PROFILER_STARTUP_INTERVAL and MOZ_PROFILER_STARTUP_FILTERS:
- If it looks like the buffer is not large enough, you can tweak the buffer size with the env var
MOZ_PROFILER_STARTUP_ENTRIES. This defaults to 1000000, which is 9MB. If you want 90MB use 10000000, and 20000000 for 180MB, which are good values to debug long startups. - If you'd like a coarser resolution, you can also choose a different interval using
MOZ_PROFILER_STARTUP_INTERVAL, which defaults to 1 (unit is millisecond). You can't go below 1 ms but you can use e.g. 10 ms. - If the default threads to be profiled are insufficient, you can choose which threads to profile using
MOZ_PROFILER_STARTUP_FILTERS, which is a comma separated list.
Description of all available environment variables may be printed by starting Firefox with MOZ_PROFILER_HELP=1 set.
If you want to profile Firefox for Android, you have to set this environment values by --es option of am command to launch Firefox. This example is for Firefox Nightly (package name is org.mozilla.fennec_aurora), and you have to allow storage access on permission settings before launching it.
adb shell am start -n org.mozilla.fennec_aurora/.App \
  --es env0 MOZ_PROFILER_STARTUP=1 \
  --es env1 MOZ_PROFILER_SHUTDOWN=/sdcard/Download/profiler.json
Then, if you select Quit menu, you can collect profiling data to MOZ_PROFILER_SHUTDOWN file.
Profiling JS benchmark (xpcshell)
- To profile the script
run.jswith IonMonkey (-I), type inference (-n) and JäegerMonkey (-m). Thgis requires the following command:
The xpcshell output all benchmark information and on its last line it output the result of the profiling, you can filter it with$ xpcshell -m -I -n -e ' const Ci = Components.interfaces; const Cc = Components.classes; var profiler = Cc["@mozilla.org/tools/profiler;1"].getService(Ci.nsIProfiler); profiler.StartProfiler( 10000000 /* = profiler memory */, 1 /* = sample rate: 100µs with patch, 1ms without */, ["stackwalk", "js"], 2 /* = features, and number of features. */ ); ' -f ./run.js -e ' var profileObj = profiler.getProfileData(); print(JSON.stringify(profileObj)); ' | tail -n 1 > run.cleotail -n 1and redirect it to a file to prevent printing it in your shell. The expected size of the output is around 100 of MB. - To add symbols to your build, you need to call
./scripts/profile-symbolicate.pyavailable in B2G repository.$ GECKO_OBJDIR=<objdir> PRODUCT_OUT=<objdir> TARGET_TOOLS_PREFIX= \ ./scripts/profile-symbolicate.py -o run.symb.cleo run.cleo - Clone Cleopatra and start the server with
./run_webserver.sh. - Access Cleopatra from your web browser by loading the page
localhost:8000, and uploadrun.symb.cleoto render the profile with most of the symbol information.
Native stack vs. label stack
The profiler periodically samples the stack of the selected threads in Firefox and collects a stack trace. This stack trace is the combined stack of three different stacks: The native stack, the JavaScript stack, and the label stack.
Native stack
The native stack is the regular C / C++ / rust function stack that you know from your debugger. It's only collected if the "Stack walk" checkbox in the gecko profiler add-on's settings is checked.
JavaScript stack
The JavaScript stack is collected by the JS engine. This is controlled by the "JavaScript" checkbox in the gecko profiler add-on's settings panel.
Label stack
The label stack (formerly called "Pseudo stack") uses function entry/exit tags added by hand to important points in the code base. The stacks you see in the UI are chains of these tags. This is good for highlighting particularly interesting parts of the code, but they miss out on un-annotated areas of the code base, and give no visibility into system libraries or drivers.
Tagging is done by adding macros of the form AUTO_PROFILER_LABEL("NAMESPACE", "NAME"). These add RAII helpers, which are used by the profiler to track entries/exits of the annotated functions. For this to be effective, you need to liberally use AUTO_PROFILER_LABEL throughout the code. See GeckoProfiler.h for more variations like AUTO_PROFILER_LABEL_DYNAMIC.
Because of the non-zero overhead of the instrumentation, the sample label shouldn't be placed inside hot loops. A profile reporting that a large portion is spent in "Unknown" code indicates that the area being executed doesn't have any sample labels. As we focus on using this tool and add additional sample labels coverage should improve.
Sharing, saving and loading profiles
After capturing and viewing a profile you will see "Share..." and "Save as file..." buttons in the top-right of the window. Sharing will upload your profile to profiler.firefox.com and make it public. More information on sharing profiles is available.
Profiling a hung process
It is possible to get profiles from hung Firefox processes using lldb1.
- After the process has hung, attach lldb.
- Type in2, :
p (void)
profiler_save_profile_to_file("somepath/profile.txt") - Clone mstange’s handy profile analysis repository.
- Run:
python symbolicate_profile.py somepath/profile.txt
To graft symbols into the profile. mstange’s scripts do some fairly clever things to get those symbols – if your Firefox was built by Mozilla, then it will retrieve the symbols from the Mozilla symbol server. If you built Firefox yourself, it will attempt to use some cleverness3 to grab the symbols from your binary.
Your profile will now, hopefully, be updated with symbols. Upload it for further analysis!
I haven’t yet had the opportunity to try this, but I hope to next week. I’d be eager to hear people’s experience giving this a go – it might be a great tool in determining what’s going on in Firefox when it’s hung!
Profiling Threads
The Firefox Profiler has rudimentary support for profiling multiple threads. To enable it, check the 'Multi-Thread' box then enter one or more thread names into the textbox beside it. Thread names are the strings passed to the base::Thread class at initialization. At present there is no central list of these thread names, but you can find them by grepping the source.
If the filter you entered is invalid, no threads will be profiled. You can identify this by hitting Analyze (Cleopatra will show you an error message). If the filter is left empty, only the main thread is captured (as if you had not enabled Multi-Thread.)
Profiler Features
The profiler supports several features. These are options to gather additional data in your profiles. Each option will increase the performance overhead of profiling so it's important to activate only options that will provide useful information for your particular problem to reduce the distortion.
All options may be set in about:profiling or through the MOZ_PROFILER_STARTUP_FEATURES environement variable. Here are the main ones:
Native Stacks - "stackwalk"
When taking a sample the profiler will attempt to unwind the stack using platform specific code appropriate for the ABI. This will provide an accurate callstack for most samples. On ABIs where framepointers are not available this will cause a significant performance impact.
Alternatively, Native Leaf Stack ("leaf") only records the top-most frame.
JavaScript - "js"
Javascript callstacks will be generated and interleaved with the c++ callstacks. This will introduce an overhead when running JS.
Main Thread File IO, Profiled Thread File IO, All File IO - "mainthreadio", "fileio", "allfileio"
This will interpose file I/O from a selection of threads, and report them in the profiles.
Screenshots
This will insert screenshots into the profile. It may have significant performance impact, especially on graphics operations.
Viewing the Layer Tree
To view the layer tree, the layers.dump pref must be set to true in the Firefox or B2G program being profiled.
In addition, both the compositor thread and the content thread (in the case of B2G, the content thread of whichever app you're interested in) must be profiled. For example, on B2G, when profiling the Homescreen app, you might start the profiler with:
./profile.sh start -p b2g -t Compositor && ./profile.sh start -p Homescreen
Having gotten a profile this way, the layer tree for a composite can be seen by clicking on a composite in the "Frames" section of Cleopatra (you may need to a sub-range of samples to make individual composites large enough to be clicked). This will activate the "LayerTree" tab:
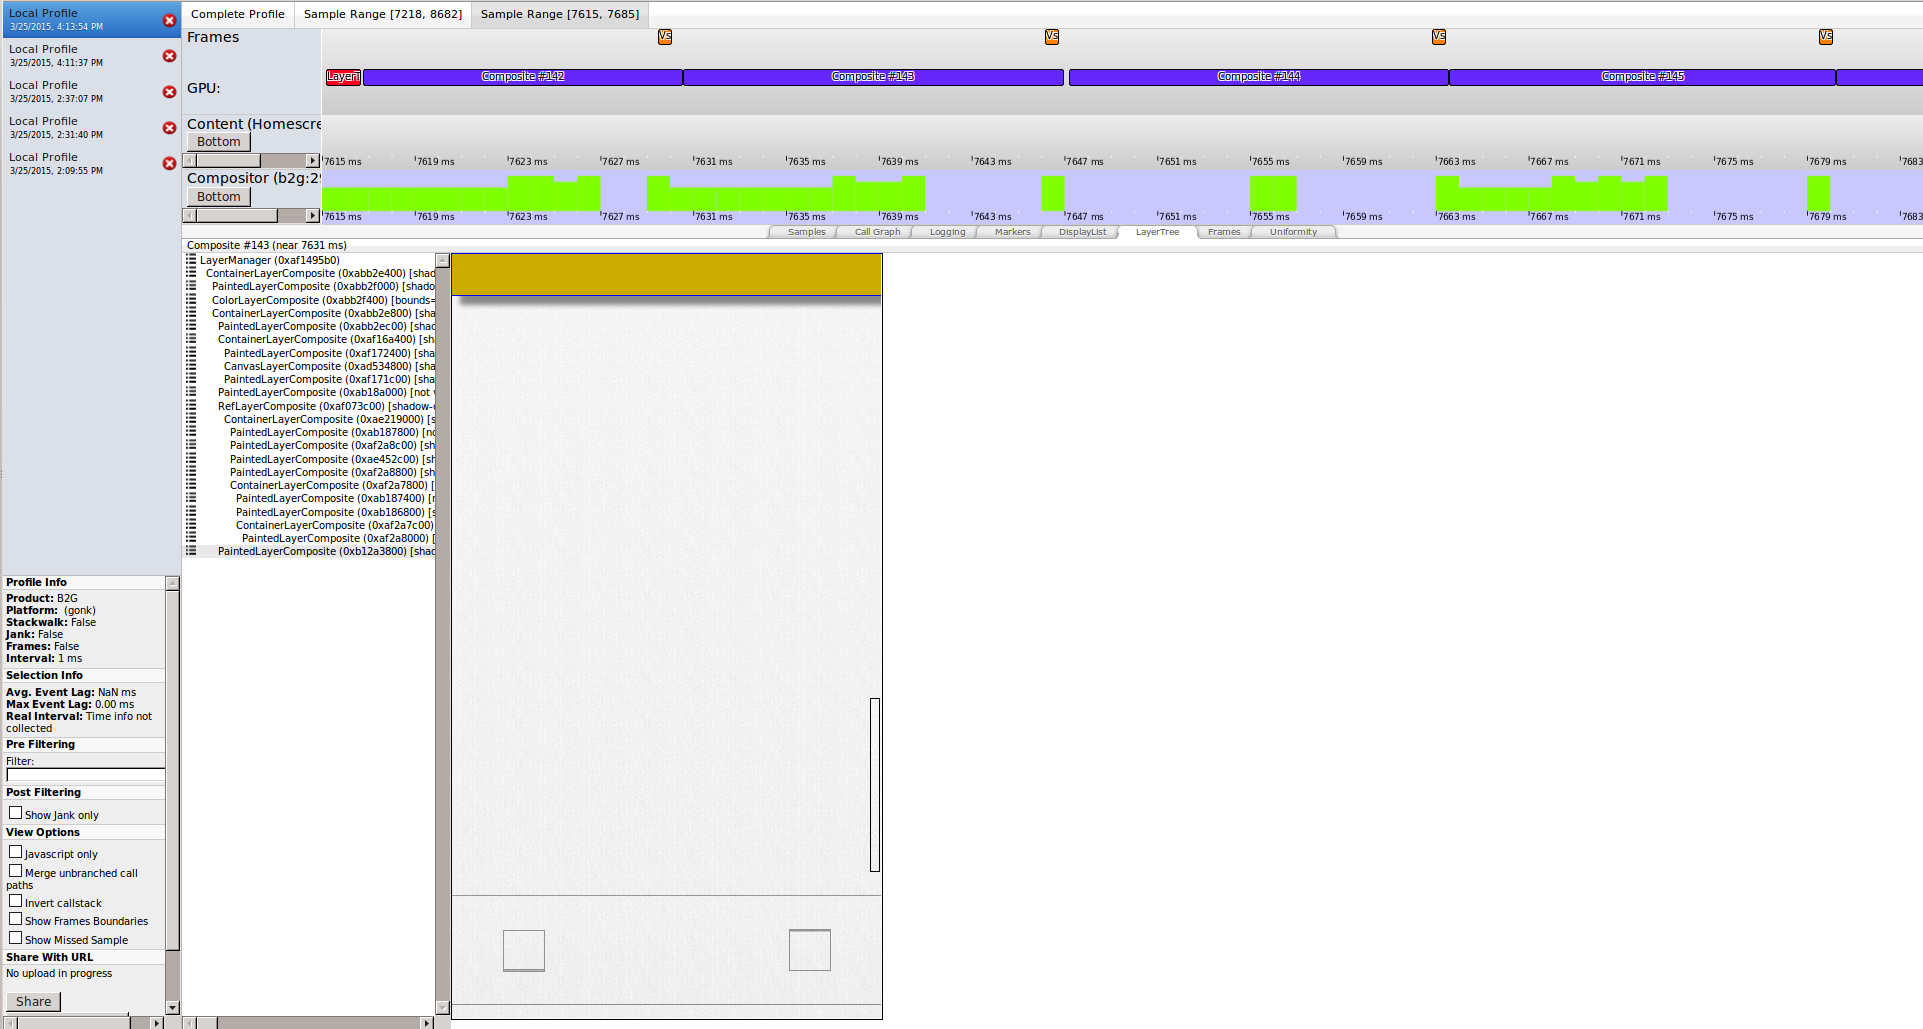
In this screenshot, Composite #143 has been selected. The layer tree structure can be seen in the left panel. It contains, for each layer, the type of the layer, and various metrics about the layer, such as the visible region and any transforms. In the right panel, a visualization of the layer tree (based entirely on the aforementioned metrics) is shown. Hovering over a layer in the left panel highlights the layer in the right panel. This is useful for identifying what content each layer corresponds to. Here, I'm hovering over the last layer in the layer tree (a PaintedLayerComposite), and a strip at the top of the right panel is highlighted, telling me that this layer is for the system notification bar in B2G.
Viewing Textures
Sometimes, it's useful to see not only the structure of the layer tree for each composite, but also the rendered textures for each layer. This can be achieved by additionally setting the layers.dump-texture pref to true, or by adding -f layersdump to the profiler command line (the latter implies both the layers.dump and layers.dump-texture prefs).
Warning: Dumping texture data slows performance considerably, and requires a lot of storage for the profile files. Expect rendering to happen at a significantly reduced frame rate when profiling this way, and keep the duration of the capture short, to ensure the samples of interest aren't overwritten.
Here's how the Layer Tree view looks in Cleopatra with texture data:
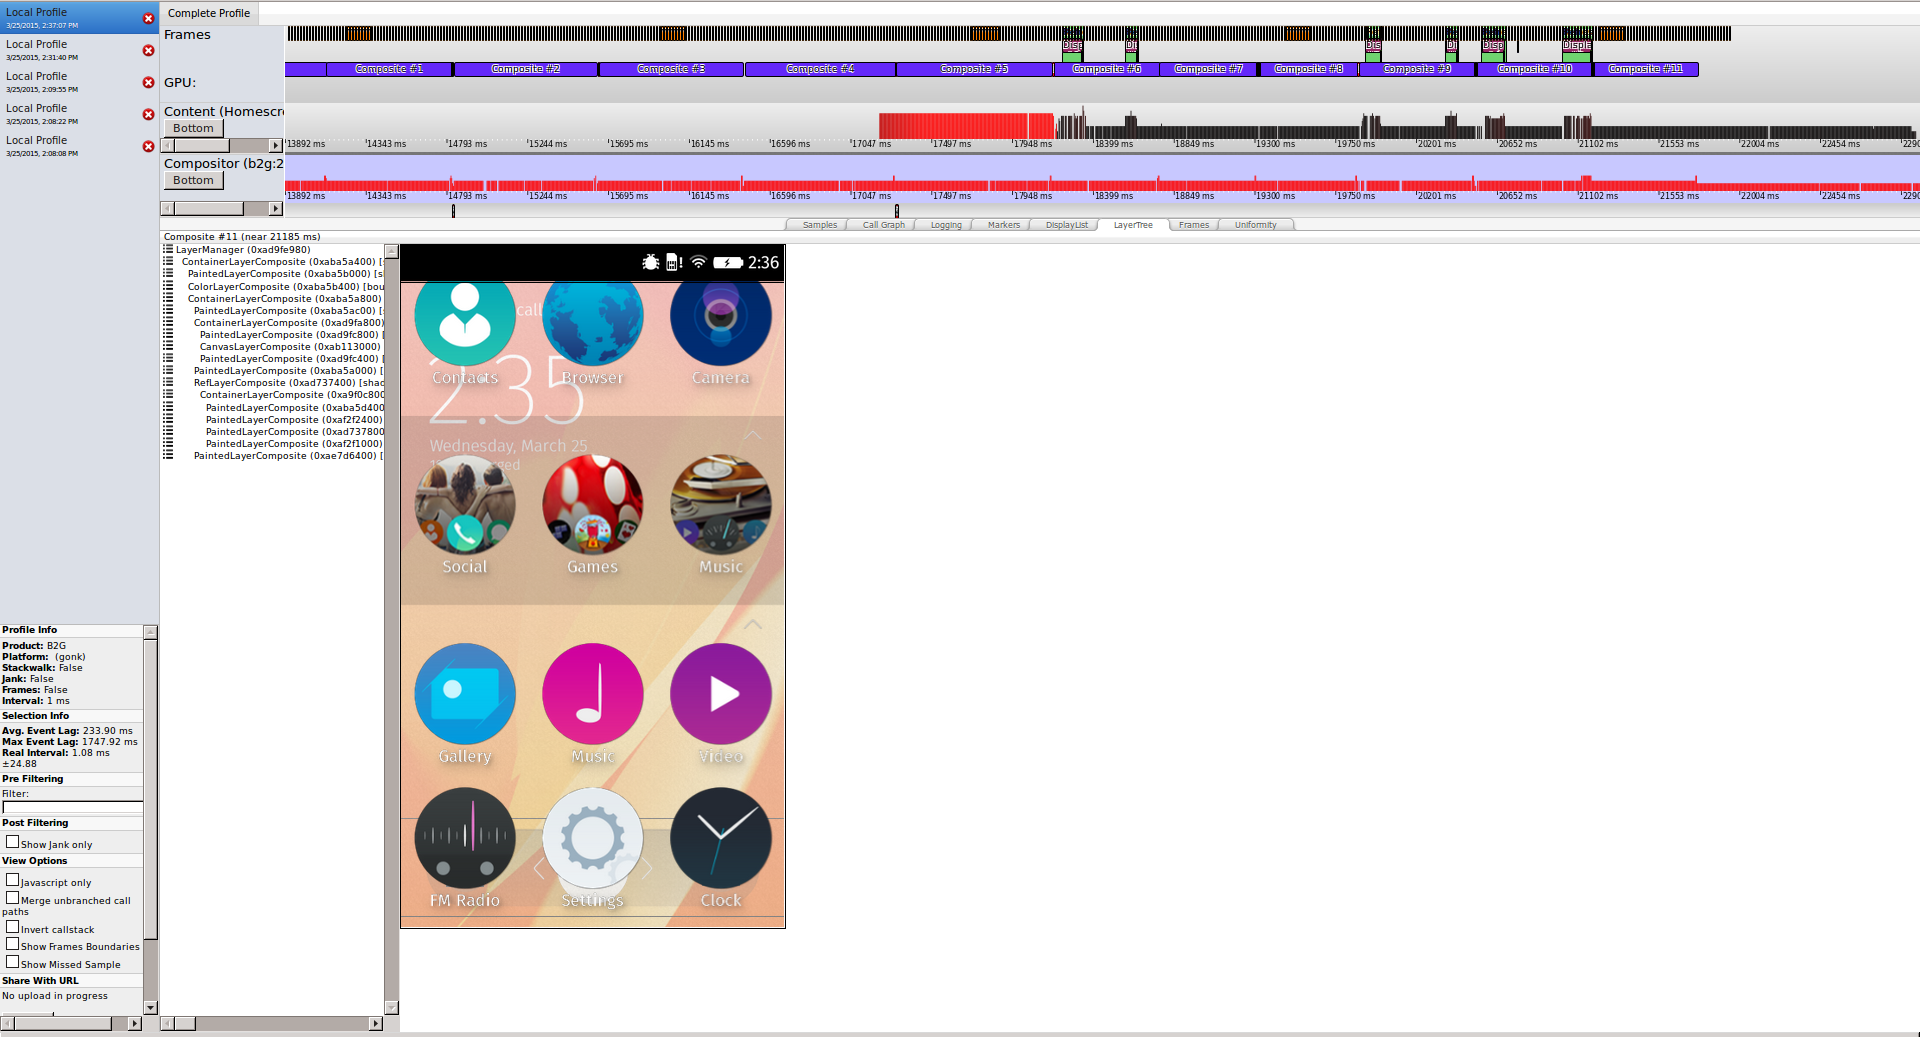
This time, the visualization in right panel shows the actual textures rather than just the outlines of the layers. This can be very useful for debugging correctness problems such as a temporary visual/rendering glitch, because it allows you to find the precise composite that shows the glitch, and look at the layer tree for that composite.
Visualizing a layer tree without a profile
If you have a layer dump from somewhere (such as from adb logcat on B2G), you can get Cleopatra to visualize it (just the structure of course, not textures) without needing a profile. To do so, paste the layer dump into the "Enter your profile data here" text field on the front page of Cleopatra:
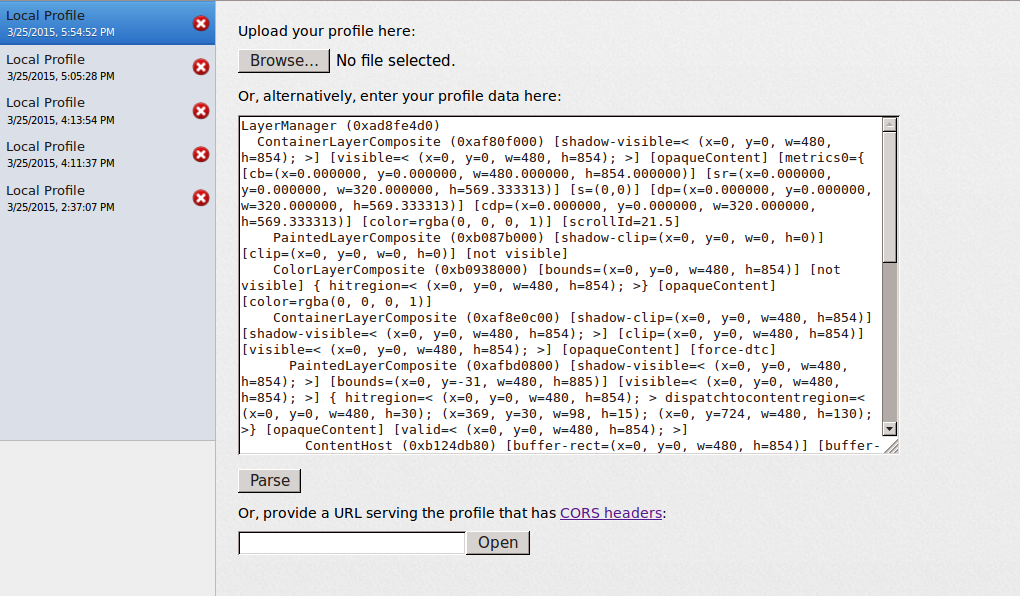
The resulting "profile" will have the Layer Tree view enabled (but nothing else). This is useful in cases where you want to gain a quick visual understanding of a layer dump without having to take a profile.
On B2G, each line of a layer dump in adb logcat output is prefixed with something like I/Gecko (30593):. Cleopatra doesn't currently understand this prefix, so it needs to be removed before pasting.
Display List
Dump the display list after each refresh with the texture data. This can be used to debug correctness problems.
Contribute
- Source is located in
tools/profiler. - The Bugzilla components are Core::Gecko Profile for the profiler backend, and DevTools::Performance Tools (Profiler/Timeline) for the toolbar button and about:profiling.
- The (now obsolete) profiler add-on repository can be found here: https://github.com/firefox-devtools/Gecko-Profiler-Addon.
- The profiler.firefox.com code and issue repository can be found here: https://github.com/firefox-devtools/profiler/.