
This guide will help Firefox developers working on front-end code produce code which is as performant as possible—not just on its own, but in terms of its impact on other parts of Firefox. Always keep in mind the side effects your changes may have, from blocking other tasks, to interfering with other user interface elements.
Avoid the main thread where possible
The main thread is where we process user events and do painting. It's also important to note that most of our JavaScript runs on the main thread, so it's easy for script to cause delays in event processing or painting. That means that the more code we can get off of the main thread, the more that thread can respond to user events, paint, and generally be responsive to the user.
You might want to consider using a Worker if you need to do some computation that can be done off of the main thread. If you need more elevated privileges than a standard worker allows, consider using a ChromeWorker, which is a Firefox-only API which lets you create workers with more elevated privileges.
Use requestIdleCallback()
If you simply cannot avoid doing some kind of long job on the main thread, try to break it up into smaller pieces that you can run when the browser has a free moment to spare, and the user isn't doing anything. You can do that using requestIdleCallback() and the Cooperative Scheduling of Background Tasks API, and doing it only when we have a free second where presumably the user isn’t doing something.
See also the blog post Collective scheduling with requestIdleCallback.
As of bug 1353206, you can also schedule idle events in non-DOM contexts by using Services.tm.idleDispatchToMainThread. See the nsIThreadManager.idl file for more details.
Hide your panels
If you’re adding a new XUL <xul:popup> or <xul:panel> to a document, set the attribute to true by default. By doing so, you cause the binding applied on demand rather than at load time, which makes initial construction of the XUL document faster.
Get familiar with the pipeline that gets pixels to the screen
Learn how pixels you draw make their way to the screen. Knowing the path they will take through the various layers of the browser engine will help you optimize your code to avoid pitfalls.
The rendering process goes through the following steps: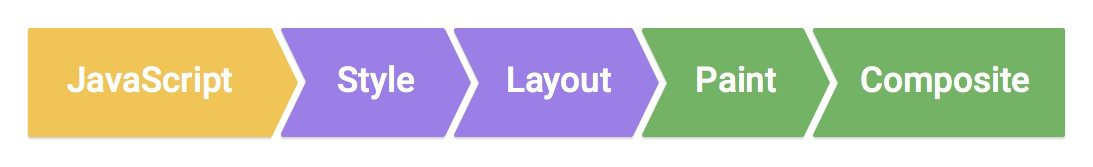
The above image is used under Creative Commons Attribution 3.0, courtesy of this page from our friends at Google, which itself is well worth the read.
For a very down-to-earth explanation of the Style, Layout, Paint and Composite steps of the pipeline, this Hacks blog post does a great job of explaining it.
To achieve a 60 FPS frame rate, all of the above has to happen in 16 milliseconds or less, every frame.
Note that requestAnimationFrame() lets you queue up JavaScript to run right before the style flush occurs. This allows you to put all of your DOM writes (most importantly, anything that could change the size or position of things in the DOM) just before the style and layout steps of the pipeline, combining all the style and layout calculations into a single batch so it all happens once, in a single frame tick, instead of across multiple frames. See Detecting and avoiding synchronous reflow below for more information.
This also means that requestAnimationFrame() is not a good place to put queries for layout or style information.
Detecting and avoiding synchronous style flushes
What are style flushes?
When CSS is applied to a document (HTML or XUL, it doesn’t matter), the browser does calculations to figure out which CSS styles will apply to each element. This happens the first time the page loads and the CSS is initially applied, but can happen again if JavaScript modifies the DOM.
JavaScript code might, for example, change DOM node attributes (either directly or by adding or removing classes from elements), and can also add, remove, or delete DOM nodes. Because styles are normally scoped to the entire document, the cost of doing these style calculations is proportional to the number of DOM nodes in the document (and the number of styles being applied).
It is expected that over time, script will update the DOM, requiring us to recalculate styles. Normally, the changes to the DOM just result in the standard style calculation occurring immediately after the JavaScript has finished running during the 16ms window, inside the "Style" step. That's the ideal scenario.
However, it's possible for script to do things that force multiple style calculations (or style flushes) to occur synchronously during the JavaScript part of the 16 ms window. The more of them there are, the more likely they'll exceed the 16ms frame budget. If that happens, some of them will be postponed until the next frame (or possibly multiple frames, if necessary), this skipping of frames is called jank.
Generally speaking, you force a synchronous style flush any time you query for style information after the DOM has changed within the same frame tick. Depending on whether or not the style information you’re asking for has something to do with size or position, you may also cause a layout recalculation (also referred to as layout flush or reflow), which is also an expensive step (see Detecting and avoiding synchronous reflow below).
To avoid this: avoid reading style information if you can. If you must read style information, do so at the very beginning of the frame, before any changes have been made to the DOM since the last time a style flush occurred.
Historically, there hasn't been an easy way of doing this - however, bug 1434376 has recently landed some ChromeOnly helpers to the window binding to make this simpler.
If you want to queue up some JavaScript to run after the next "natural" style and layout flush, try:
// Suppose we want to get the computed "display" style of some node without
// causing a style flush. We could do it this way:
async function nodeIsDisplayNone(node) {
  let display = await window.promiseDocumentFlushed(() => {
    // Do _not_ under any circumstances write to the DOM in one of these
    // callbacks!
    return window.getComputedStyle(node).display;
  });

  return display == "none";
}
See Detecting and avoiding synchronous reflow for a more advanced example of getting layout information, and then setting it safely, without causing flushes.
promiseDocumentFlushed is only available to priviledged script, and should be called on the inner window of a top-level frame. Calling it on the outer window of a subframe is not supported, and calling it from within the inner window of a subframe might cause the callback to fire even though a style and layout flush will still be required. These gotchas should be fixed by bug 1441173.
For now, it is up to you as the consumer of this API to not accidentally write to the DOM within the promiseDocumentFlushed callback. Doing so might cause flushes to occur for other promiseDocumentFlushed callbacks that are scheduled to fire in the same tick of the refresh driver. bug 1441168 tracks work to make it impossible to modify the DOM within a promiseDocumentFlushed callback.
Writing tests to ensure you don’t add more synchronous style flushes
Unlike reflow, there isn’t a “observer” mechanism for style recalculations. However, as of Firefox 49, the nsIDOMWindowUtils.elementsRestyled attribute records a count of how many style calculations have occurred for a particular DOM window.
It should be possible to write a test that gets the nsIDOMWindowUtils for a browser window, records the number of styleFlushes, then synchronously calls the function that you want to test, and immediately after checks the styleFlushes attribute again. If the value went up, your code caused synchronous style flushes to occur.
Note that your test and function must be called synchronously in order for this test to be accurate. If you ever go back to the event loop (by yielding, waiting for an event, etc), style flushes unrelated to your code are likely to run, and your test will give you a false positive.
Detecting and avoiding synchronous reflow
This is also sometimes called “sync layout”, "sync layout flushes" or “sync layout calculations”
Sync reflow is a term bandied about a lot, and has negative connotations. It's not unusual for an engineer to have only the vaguest sense of what it is—and to only know to avoid it. This section will attempt to demystify things.
The first time a document (XUL or HTML) loads, we parse the markup, and then apply styles. Once the styles have been calculated, we then need to calculate where things are going to be placed on the page. This layout step can be seen in the “16ms” pipeline graphic above, and occurs just before we paint things to be composited for the user to see.
It is expected that over time, script will update the DOM, requiring us to recalculate styles, and then update layout. Normally, however, the changes to the DOM just result in the standard style calculation that occurs immediately after the JavaScript has finished running during the 16ms window.
Interruptible reflow
Since the early days, Gecko has had the notion of interruptible reflow. This is a special type of content-only reflow that checks at particular points whether or not it should be interrupted (usually to respond to user events).
Because interruptible reflows can only be interrupted when laying out content, and not chrome UI, the rest of this section is offered only as context.
When an interruptible reflow is interrupted, what really happens is that certain layout operations can be skipped in order to paint and process user events sooner.
When an interruptible reflow is interrupted, the best-case scenario is that all layout is skipped, and the layout operation ends.
The worst-case scenario is that none of the layout can be skipped despite being interrupted, and the entire layout calculation occurs.
Reflows that are triggered "naturally" by the 16ms tick are all considered interruptible. Despite not actually being interuptible when laying out chrome UI, striving for interruptible layout is always good practice because uninterruptible layout has the potential to be much worse (see next section).
To repeat, only interruptible reflows in web content can be interrupted.
Uninterruptible reflow
Uninterruptible reflow is what we want to avoid at all costs. Uninterruptible reflow occurs when some DOM node’s styles have changed such that the size or position of one or more nodes in the document will need to be updated, and then JavaScript asks for the size or position of anything. Since everything is pending a reflow, the answer isn't available, so everything stalls until the reflow is complete and the script can be given an answer. Flushing layout also means that styles must be flushed to calculate the most up-to-date state of things, so it's a double-whammy.
Here’s a simple example, cribbed from this blog post by Paul Rouget:
div1.style.margin = "200px";        // Line 1
var height1 = div1.clientHeight;    // Line 2
div2.classList.add("foobar");       // Line 3
var height2 = div2.clientHeight;    // Line 4
doSomething(height1, height2);      // Line 5
At line 1, we’re setting some style information on a DOM node that’s going to result in a reflow - but (at just line 1) it’s okay, because that reflow will happen after the style calculation.
Note line 2 though - we’re asking for the height of some DOM node. This means that Gecko needs to synchronously calculate layout (and styles) using an uninterruptible reflow in order to answer the question that JavaScript is asking (“What is the clientHeight of div1?”).
It’s possible for our example to avoid this synchronous, uninterruptible reflow by moving lines 2 and 4 above line 1. Assuming there weren’t any style changes requiring size or position recalculation above line 1, the clientHeight information should be cached since the last reflow, and will not result in a new layout calculation.
If you can avoid querying for the size or position of things in JavaScript, that’s the safest option—especially because it’s always possible that something earlier in this tick of JavaScript execution caused a style change in the DOM without you knowing it.
Note that given the same changes to the DOM of a chrome UI document, a single synchronous uninterruptible reflow is no more computationally expensive than an interruptible reflow triggered by the 16ms tick. It is, however, advantageous to strive for reflow to only occur in the one place (the layout step of the 16ms tick) as opposed to multiple times during the 16ms tick (which has a higher probability of running through the 16ms budget).
How do I avoid triggering uninterruptible reflow?
Here's a list of things that JavaScript can ask for that can cause uninterruptible reflow, to help you think about the problem. Note that some items in the list may be browser-specific or subject to change, and that an item not occurring explicitly in the list doesn't mean it doesn't cause reflow. For instance, at time of writing accessing event.rangeOffset triggers reflow in Gecko, and does not occur in the earlier link. If you're unsure whether something causes reflow, check!
Note how abundant the properties in that first list are. This means that when enumerating properties on DOM objects (e.g. elements/nodes, events, windows, etc.) accessing the value of each enumerated property will almost certainly (accidentally) cause uninterruptible reflow, because a lot of DOM objects have one or even several properties that do so.
If you require size or position information, you have a few options.
bug 1434376 has recently landed a helper in the window binding to make it easier for priviledged code to queue up JavaScript to run when we know that the DOM is not dirty, and size, position, and style information is cheap to query for.
Here's an example:
async function matchWidth(elem, otherElem) {
  let width = await window.promiseDocumentFlushed(() => {
    // Do _not_ under any circumstances write to the DOM in one of these
    // callbacks!
    return elem.clientWidth;
  });

  requestAnimationFrame(() => {
    otherElem.style.width = `${width}px`;
  });
}
Please see the section on promiseDocumentFlushed in Detecting and avoiding synchronous style flushes for more information on how to use the API.
Note that queries for size and position information are only expensive if the DOM has been written to. Otherwise, we're doing a cheap look-up of cached information. If we work hard to move all DOM writes into requestAnimationFrame(), then we can be sure that all size and position queries are cheap.
It's also possible (though less infallible than promiseDocumentFlushed) to queue JavaScript to run very soon after the frame has been painted, where the likelihood is highest that the DOM has not been written to, and layout and style information queries are still cheap. This can be done by using a setTimeout or dispatching a runnable inside a requestAnimationFrame callback, for example:
requestAnimationFrame(() => {
  setTimeout(() => {
    // This code will be run ASAP after Style and Layout information have
    // been calculated and the paint has occurred. Unless something else
    // has dirtied the DOM very early, querying for style and layout information
    // here should be cheap.
  }, 0);
});

// Or, if you are running in privileged JavaScript and want to avoid the timer overhead,
// you could also use:

requestAnimationFrame(() => {
  Services.tm.dispatchToMainThread(() => {
    // Same-ish as above.
  });
});
This also implies that querying for size and position information in requestAnimationFrame() has a high probability of causing a synchronous reflow.
Other useful methods
Below you'll find some suggestions for other methods which may come in handy when you need to do things without incurring synchronous reflow. These methods generally return the most-recently-calculated value for the requested value, which means the value may no longer be current, but may still be "close enough" for your needs. Unless you need precisely accurate information, they can be valuable tools in your performance toolbox.
nsIDOMWindowUtils.getBoundsWithoutFlushing()
getBoundsWithoutFlushing() does exactly what its name suggests: it allows you to get the bounds rectangle for a DOM node contained in a window without flushing layout. This means that the information you get is potentially out-of-date, but allows you to avoid a sync reflow. If you can make do with information that may not be quite current, this can be helpful.
nsIDOMWindowUtils.getRootBounds()
Like getBoundsWithoutFlushing(), getRootBounds() lets you get the dimensions of the window without risking a synchronous reflow.
nsIDOMWindowUtils.getScrollXY()
Returns the window's scroll offsets without taking the chance of causing a sync reflow.
Writing tests to ensure you don’t add more unintentional reflow
The interface nsIReflowObserver lets us detect both interruptible and uninterruptible reflows. A number of tests have been written that exercise various functions of the browser (opening tabs, opening windows) and ensure that we don’t add new uninterruptible reflows accidentally while those actions occur.
You should add tests like this for your feature if you happen to be touching the DOM.
Detecting over-painting with paint flashing
Painting is, in general, cheaper than both style calculation and layout calculation; still, the more you can avoid, the better. Generally speaking, the larger an area that needs to be repainted, the longer it takes. Similarly, the more things that need to be repainted, the longer it takes.
Our graphics team has added a handy feature to help you detect when and where paints are occurring. This feature is called “paint flashing,” and it can be activated for both web content and the browser chrome. Paint flashing tints each region being painted with a randomly selected color so that it’s more easy to see what on the screen is being painted.
- You can activate paint flashing for browser chrome by setting
nglayout.debug.paint_flashing_chrometotrue. - You can activate paint flashing for web content by setting
nglayout.debug.paint_flashingtotrue.
After enabling these, exercise your function and see what’s painting. See a lot of flashing / colors? That means a lot of painting is going on. The worst case is called over-painting. This is when you draw multiple times over the same space. Unless transparency is involved, all but the last painting will be overwritten, becoming unnecessary. If you can find ways to avoid doing this, you can save substantial time.
Keep in mind that painting occurs on the main thread. Remember, too, that the goal is to have as little happen on the main thread as possible. That means that finding and removing (when possible) over-painting is a good place to start reducing your burden on the main thread, which will in turn improve performance.
Perhaps you’re animating something that requires a repaint? For example, transitioning the background-color of a DOM node from red to blue will result in a repaint for every frame of the animation, and paint flashing will reveal that. Consider using a different animation that can be accelerated by the GPU. These GPU-accelerated animations occur off of the main thread, and have a much higher probability of running at 60 FPS (see the section below called Use the compositor for animations for further details).
Perhaps you’re touching some DOM nodes in such a way that unexpected repaints are occurring in an area that don’t need it. Best to investigate and try to remove those as best you can. Sometimes, our graphics layer invalidates regions in ways that might not be clear to you, and a section outside of the thing that just repainted will also repaint. Sometimes this can be addressed by ensuring that the thing changing is on its own layer (though this comes at a memory cost). You can put something on its own layer by setting its z-index, or by setting the will-change on the node, though this should be used sparingly.
If you’re unsure why something is repainting, consider talking to our always helpful graphics team in the gfx room on Matrix, and they can probably advise you. Note that a significant number of the graphics team members are in the US Eastern Time zone (UTC-5 or UTC-4 during Daylight Saving Time), so let that information guide your timing when you ask questions in the gfx room .
Adding nodes using DocumentFragments
Sometimes you need to add several DOM nodes as part of an existing DOM tree. For example, when using XUL <xul:menupopup>s, you often have script which dynamically inserts <xul:menuitem>s. Inserting items into the DOM has a cost. If you're adding a number of children to a DOM node in a loop, it's often more efficient to batch them into a single insertion by creating a DocumentFragment, adding the new nodes to that, then inserting the DocumentFragment as a child of the desired node.
A DocumentFragment is maintained in memory outside the DOM itself, so changes don't cause reflow. The API is straightforward:
- Create the
DocumentFragmentby callingDocument.createDocumentFragment(). - Create each child element (by calling
Document.createElement()for example), and add each one to the fragment by callingDocumentFragment.appendChild(). - Once the fragment is populated, append the fragment to the DOM by calling
appendChild()on the parent element for the new elements.
This example has been cribbed from davidwalsh’s blog post:
// Create the fragment

var frag = document.createDocumentFragment();

// Create numerous list items, add to fragment

for(var x = 0; x < 10; x++) {
    var li = document.createElement("li");
    li.innerHTML = "List item " + x;
    frag.appendChild(li);
}

// Mass-add the fragment nodes to the list

listNode.appendChild(frag);
The above is strictly cheaper than individually adding each node to the DOM.
The Gecko profiler add-on is your friend
The Gecko profiler is your best friend when diagnosing performance problems and looking for bottlenecks. There’s plenty of excellent documentation on MDN about the Gecko profiler:
Don’t guess—measure.
If you’re working on a performance improvement, this should go without saying: ensure that what you care about is actually improving by measuring before and after.
Landing a speculative performance enhancement is the same thing as landing speculative bug fixes—these things need to be tested. Even if that means instrumenting a function with a Date.now() recording at the entrance, and another Date.now() at the exit points in order to measure processing time changes.
Prove to yourself that you’ve actually improved something by measuring before and after.
Use the performance API
The performance API is very useful for taking high-resolution measurements. This is usually much better than using your own hand-rolled timers to measure how long things take. You access the API through Window.performance.
Also, the Gecko profiler back-end is in the process of being modified to expose things like markers (from window.performance.mark()).
Use the compositor for animations
Performing animations on the main thread should be treated as deprecated. Avoid doing it. Instead, animate using Element.animate(). See the article Animating like you just don't care for more information on how to do this.
Explicitly define start and end animation values
Some optimizations in the animation code of Gecko are based on an expectation that the from (0%) and the to (100%) values will be explicitly defined in the @keyframes definition. Even though these values may be inferred through the use of initial values or the cascade, the offscreen animation optimizations are dependent on the explicit definition. See this comment and a few previous comments on that bug for more information.
Use IndexedDB for storage
AppCache and LocalStorage are synchronous storage APIs that will block the main thread when you use them. Avoid them at all costs!
IndexedDB is preferable, as the API is asynchronous (all disk operations occur off of the main thread), and can be accessed from web workers.
IndexedDB is also arguably better than storing and retrieving JSON from a file—particularly if the JSON encoding or decoding is occurring on the main thread. IndexedDB will do JavaScript object serialization and deserialization for you using the structured clone algorithm, meaning that you can stash things like maps, sets, dates, blobs, and more, without having to do conversions for JSON compatibility.
A Promise-based wrapper for IndexedDB, IndexedDB.jsm, is available for chrome code.
Test on weak hardware
For the folks paid to work on Firefox, we tend to have pretty powerful hardware for development. This is great, because it reduces build times, and means we can do our work faster.
We should remind ourselves that the majority of our user base is unlikely to have similar hardware. Look at the Firefox Hardware Report to get a sense of what our users are working with. Test on slower machines to make it more obvious to yourself if what you’ve written impacts the performance of the browser.
Consider loading scripts with the subscript loader asynchronously
If you've ever used the subscript loader, you might not know that it can load scripts asynchronously, and return a Promise once they're loaded. For example:
Services.scriptloader.loadSubScriptWithOptions(myScriptURL, { async: true }).then(() => {
  console.log("Script at " + myScriptURL + " loaded asynchronously!");
});