
Firefox Developer Tools is a set of web developer tools built into Firefox. You can use them to examine, edit, and debug HTML, CSS, and JavaScript.
This section contains detailed guides to all of the tools as well as information on how to debug Firefox for Android, how to extend DevTools, and how to debug the browser as a whole.
If you have any feedback on DevTools, or want to contribute to the project, you can join the DevTools community.
Note: If you are just getting started with web development and using developer tools, our learning docs will help you — see Getting started with the Web and What are browser developer tools? for good starting points.
The Core Tools
You can open the Firefox Developer Tools from the menu by selecting Tools > Web Developer > Toggle Tools or use the keyboard shortcut Ctrl + Shift + I or F12 on Windows and Linux, or Cmd + Opt + I on macOS.
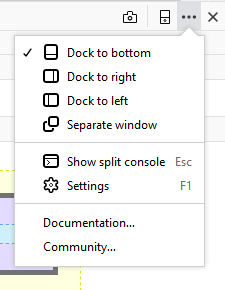
The ellipsis menu on the right-hand side of Developer Tools contains several commands that let you perform actions or change tool settings.
 |
This button only appears when there are multiple iframes on a page. Click it to display a list of the iframes on the current page and select the one with which you want to work. |
 |
Click this button to take a screenshot of the current page. (Note: This feature is not turned on by default and must be enabled in settings before the icon will appear.) |
 |
Toggles Responsive Design Mode. |
 |
Opens the menu that includes docking options, the ability to show or hide the split console, and Developer Tools settings. The menu also includes links to the documentation for Firefox Web Tools and the Mozilla Community. |
 |
Closes the Developer Tools |
Page Inspector
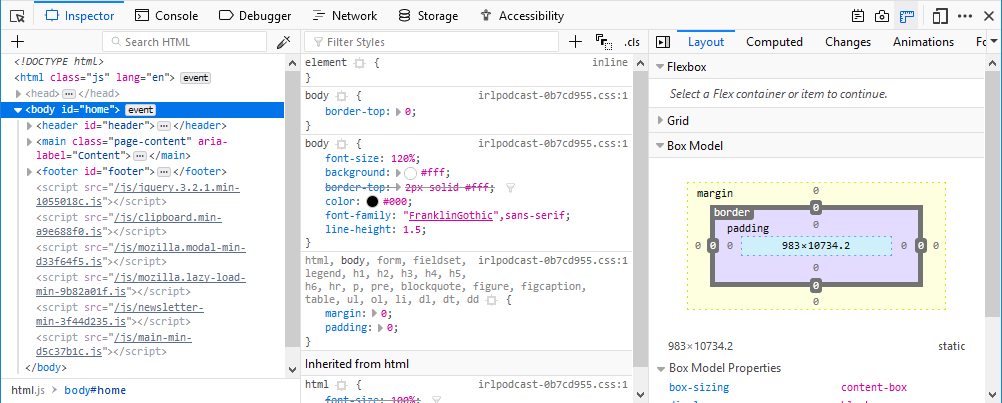
View and edit page content and layout. Visualise many aspects of the page including the box model, animations, and grid layouts.
Web Console
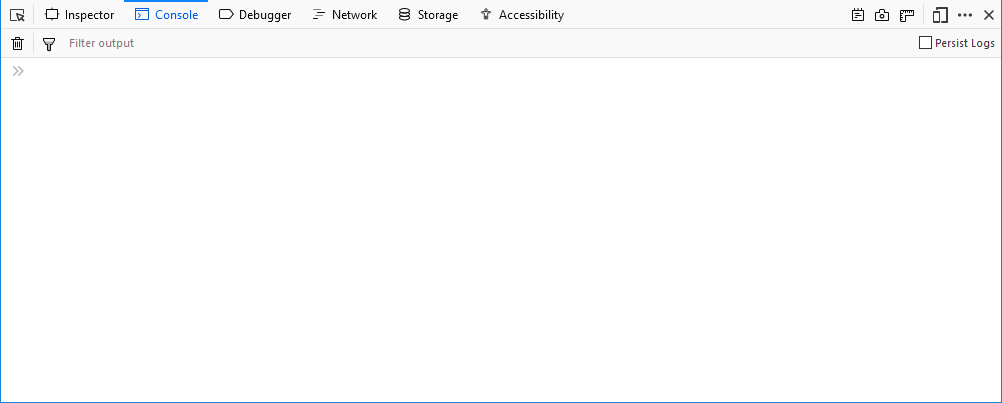
See messages logged by a web page and interact with the page using JavaScript.
JavaScript Debugger
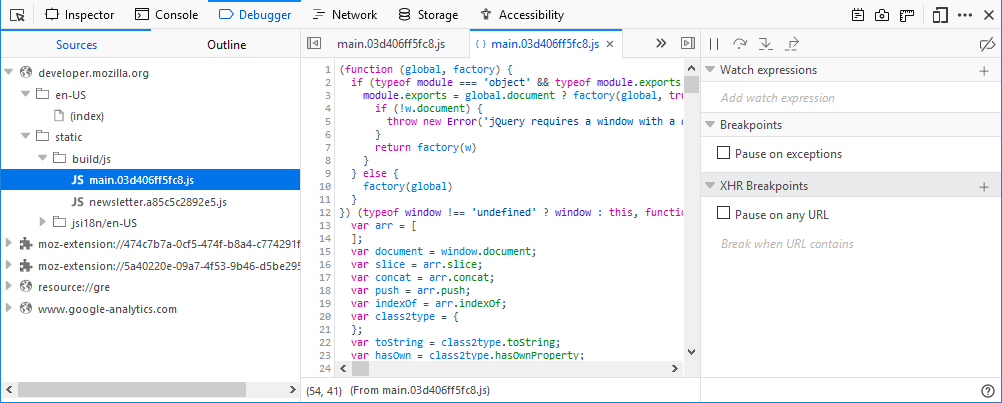
Stop, step through, examine, and modify the JavaScript running in a page.
Network Monitor
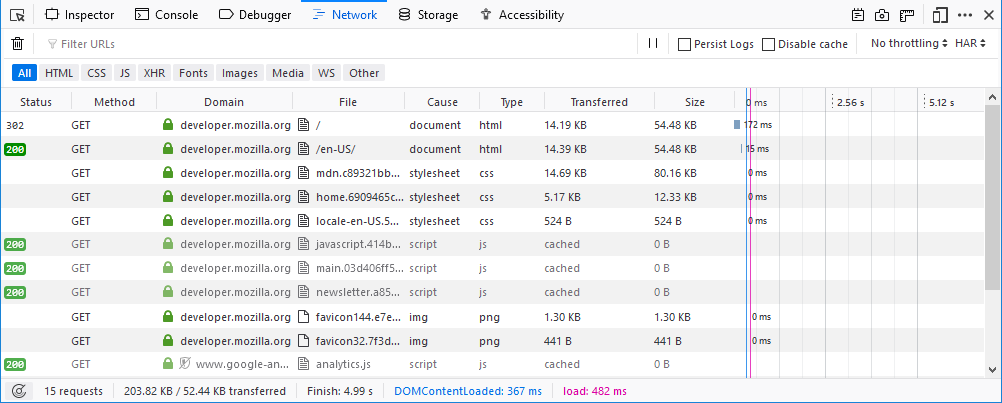
See the network requests made when a page is loaded.
Performance Tools
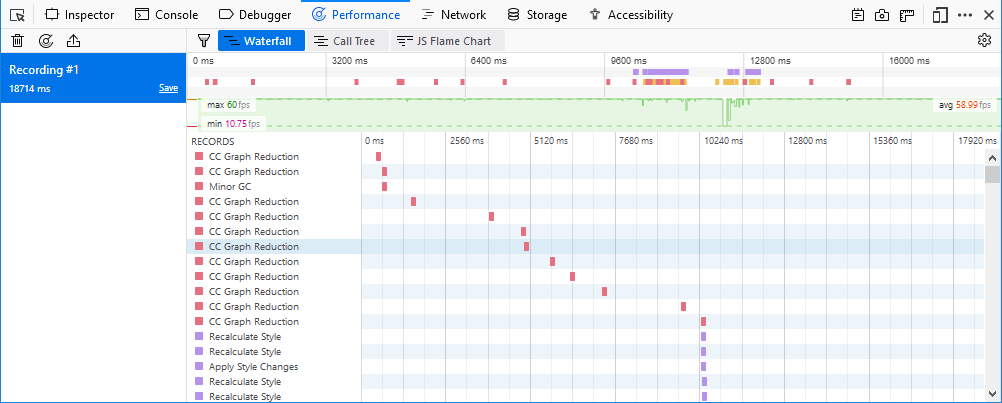
Analyze your site's general responsiveness, JavaScript, and layout performance.
Responsive Design Mode
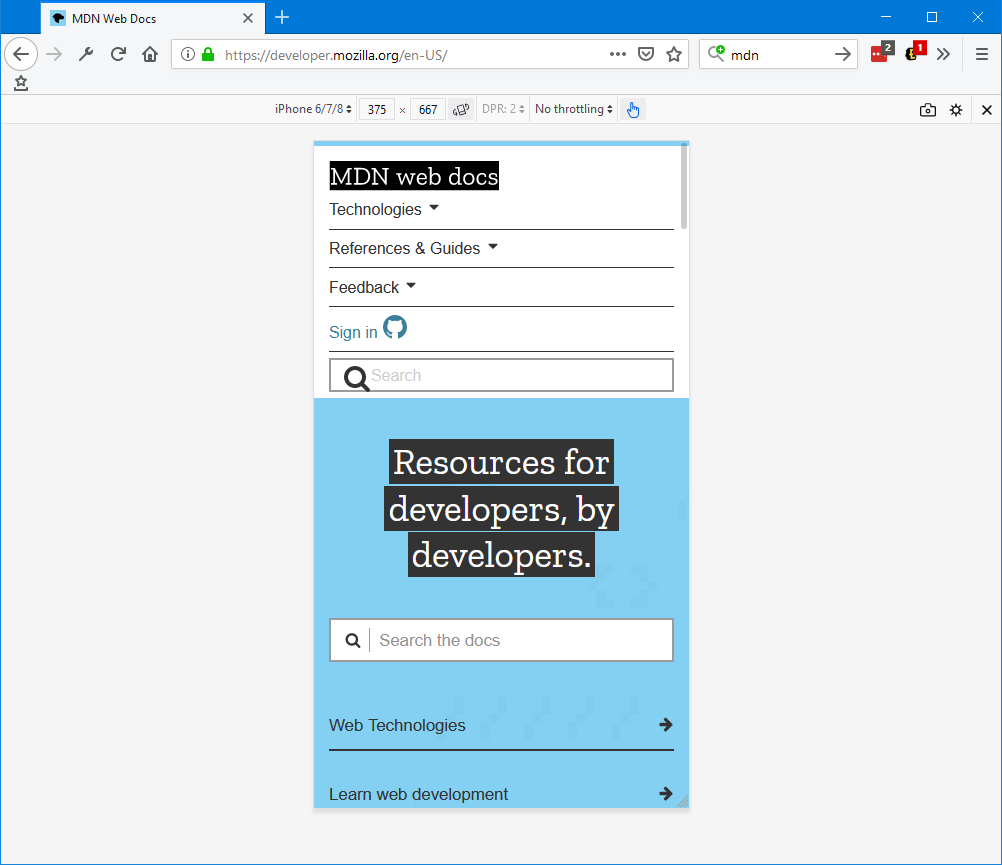
See how your website or app will look and behave on different devices and network types.
Accessibility inspector
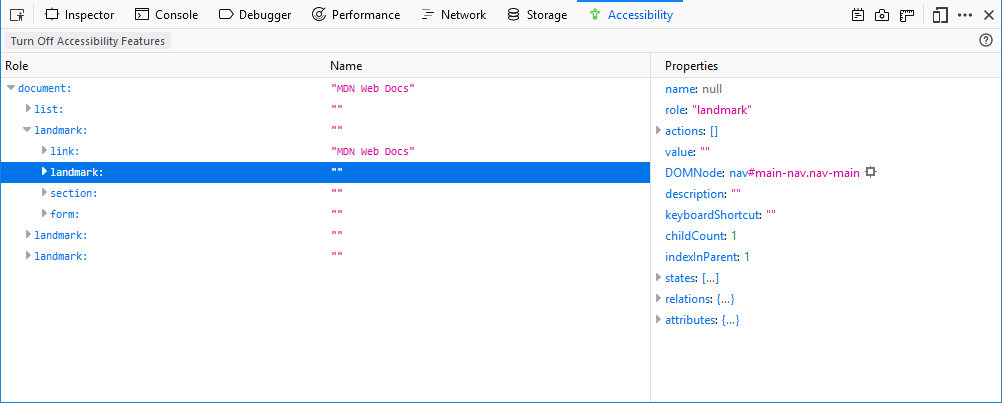
Provides a means to access the page's accessibility tree, allowing you to check what's missing or otherwise needs attention.
Application panel
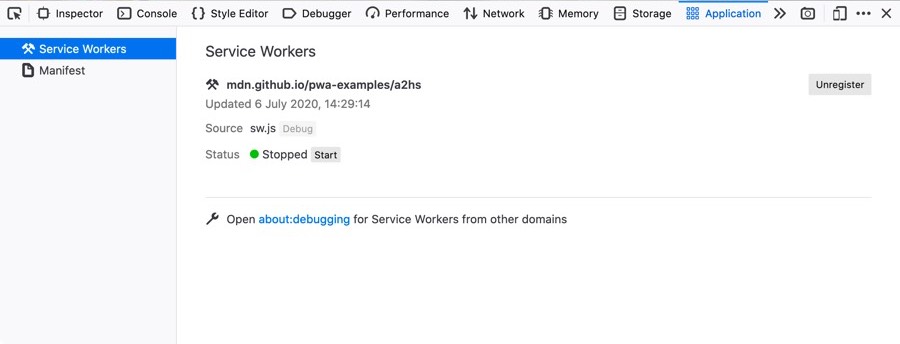
Provides tools for inspecting and debugging modern web apps (also known as Progressive Web Apps). This includes inspection of service workers and web app manifests.
Note: The collective term for the UI inside which the DevTools all live is the Toolbox.
More Tools
These developer tools are also built into Firefox. Unlike the "Core Tools" above, you might not use them every day.
- Memory
- Figure out which objects are keeping memory in use.
- Storage Inspector
- Inspect cookies, local storage, indexedDB, and session storage present in a page.
- DOM Property Viewer
- Inspect the page's DOM properties, functions, etc.
- Eyedropper
- Select a color from the page.
- Style Editor
- View and edit CSS styles for the current page.
- Taking screenshots
- Take a screenshot of the entire page or of a single element.
- Measure a portion of the page
- Measure a specific area of a web page.
- Rulers
- Overlay horizontal and vertical rulers on a web page

For the latest developer tools and features, try Firefox Developer Edition.
Connecting the Developer Tools
If you open the developer tools using keyboard shortcuts or the equivalent menu items, they'll target the document hosted by the currently active tab. But you can attach the tools to a variety of other targets, too, both within the current browser and in different browsers or even different devices.
- about:debugging
- Debug add-ons, content tabs, and workers running in the browser.
- Connecting to Firefox for Android
- Connect the developer tools to an instance of Firefox running on an Android device.
- Connecting to iframes
- Connect the developer tools to a specific iframe in the current page.
- Connecting to other browsers
- Connect the developer tools to Chrome on Android and Safari on iOS.
Debugging the browser
By default, the developer tools are attached to a web page or web app. But you can also connect them to the browser as a whole. This is useful for browser and add-on development.
- Browser Console
- See messages logged by the browser itself and by add-ons, and run JavaScript code in the browser's scope.
- Browser Toolbox
- Attach the Developer Tools to the browser itself.
Migrating from Firebug
Firebug has come to the end of its lifespan (see Firebug lives on in Firefox DevTools for details of why), and we appreciate that some people will find migrating to another less familiar set of DevTools to be challenging. To ease a transition from Firebug to the Firefox developer tools, we have written a handy guide — Migrating from Firebug.
Contribute
If you want to help improve the developer tools, these resources will get you started.
- Get Involved
- Our community website explains how to get involved.
- bugs.firefox-dev.tools
- A tool helping to find bugs to work on.