
The Toolbox provides a single home for most of the developer tools that are built into Firefox.
There are a few different ways to open the Toolbox:
- select "Toggle Tools" from the Web Developer menu (under "Tools" on OS X and Linux, or "Firefox" on Windows)
- click the wrench icon (
 ), which is in the main toolbar or under the Hamburger menu (
 ), then select "Toggle Tools"
 - activate any tool hosted in the Toolbox (for example, the JavaScript Debugger or the Page Inspector)
- press Ctrl + Shift + I on Windows and Linux, or Cmd + Opt + I on OS X. See also keyboard shortcuts.
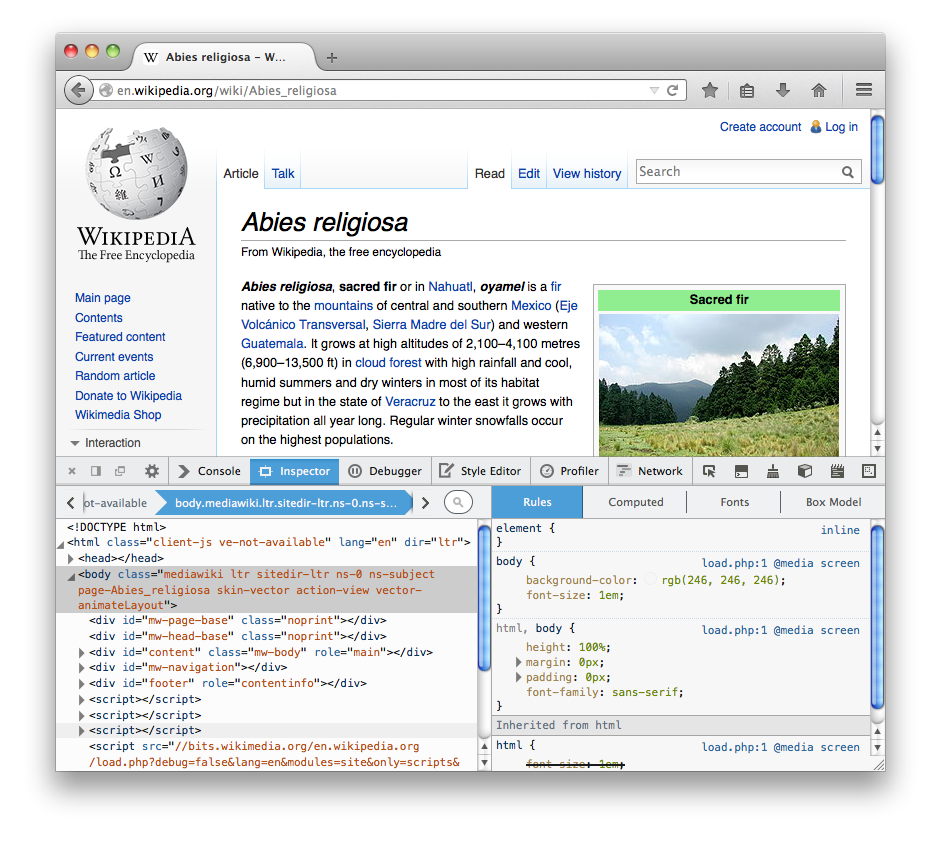
By default, the window appears docked to the bottom side of the Firefox window, but you can detach it if you like. This is what it looks like when it's docked:
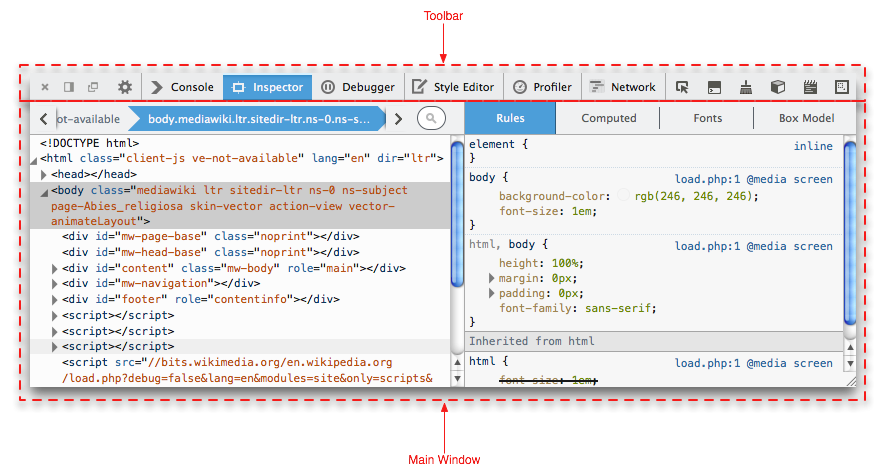
 The window itself is split into two parts: a toolbar along the top, and a main pane underneath:
Note: Since Firefox 62, you can drag and drop tabs in the main toolbar of the toolbox to reorder your tools as you wish (bug 1226272).
Docking mode
By default, the Toolbox appears docked to the bottom of the browser window, but you can also dock it to the right-hand side of the window, or make it a standalone window, using buttons in the toolbar.
Toolbar
The toolbar contains controls to activate a particular tool, to dock/float the window, and to close the window.
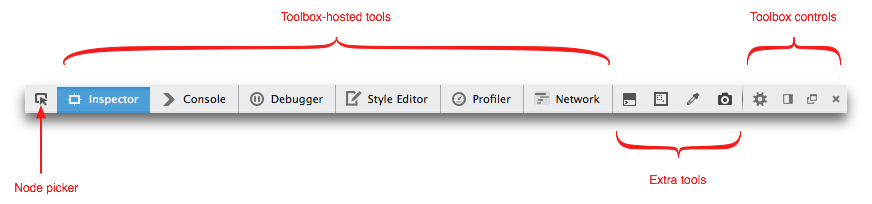
Node picker
On the far left there's a button to activate the node picker. This lets you select a page element for inspection. See "Selecting elements".
Toolbox-hosted tools
Then there is an array of labeled buttons which enables you to switch between the different tools hosted by the Toolbox. The array may include the following tools:
Note that not all the hosted tools are always listed here: only the tools actually available in this context are shown (for example, not all tools support remote debugging yet, so if the debugging target is not the Firefox instance that launched the window, not all the hosted tools will be shown).
Extra tools
Next there's an array of buttons that can be added or removed in the developer tool settings. By default this array includes:
- Toggle split console
- Responsive Design Mode
- Select a frame as the currently targeted document (this is only included by default from Firefox 41 onwards).
The following tools are not included in the toolbar by default, but you can add them in the settings:
- Highlight painted area
- 3D view (note that this is not available in Firefox 40)
- Scratchpad
- Grab a color from the page
- Take a screenshot of the entire page: take a screenshot of the complete web page and saves it in your Downloads directory
- Toggle rulers for the page
- Measure a portion of the page: measure a part of the website by selecting areas within the page
Toolbox controls
Finally there's a row of buttons to:
- close the window
- toggle the window between attached to the bottom of the browser window, and attached to the side of the browser window
- toggle the window between standalone and attached to the browser window
- access developer tool settings
Settings
See the separate page on the Developer Tools Settings.
Main Pane
The content of the main pane in the window is entirely controlled by, and specific to, the hosted tool currently selected.
Keyboard shortcuts
These shortcuts work whenever the toolbox is open, no matter which tool is active.
| Command | Windows | macOS | Linux |
|---|---|---|---|
| Cycle through tools left to right | Ctrl + ] | Cmd + ] | Ctrl + ] |
| Cycle through tools right to left | Ctrl + [ | Cmd + [ | Ctrl + [ |
| Toggle between active tool and settings. | F1 | F1 | F1 |
|
Toggle toolbox between the last 2 docking modes |
Ctrl + Shift + D | Cmd + Shift + D | Ctrl + Shift + D |
| Toggle split console (except if console is the currently selected tool) | Esc | Esc | Esc |
These shortcuts work in all tools that are hosted in the toolbox.
| Command | Windows | macOS | Linux |
|---|---|---|---|
| Increase font size | Ctrl + + | Cmd + + | Ctrl + + |
| Decrease font size | Ctrl + - | Cmd + - | Ctrl + - |
| Reset font size | Ctrl + 0 | Cmd + 0 | Ctrl + 0 |