
Found 158 pages:
| # | Page | Tags and summary |
|---|---|---|
| 1 | Firefox Developer Tools | Developing Mozilla, Guide, Tools, Web Development, Web Development:Tools, l10n:priority |
| Firefox Developer Tools is a set of web developer tools built into Firefox. You can use them to examine, edit, and debug HTML, CSS, and JavaScript. | ||
| 2 | 3D view | HTML, Tools, Web Development, Web Development:Tools |
| When you click on the 3D view button, the page goes into 3D view mode; in this mode, you can see your page presented in a 3D view in which nested blocks of HTML are increasingly "tall," projecting outward from the bottom of the page. This view makes it easy to visualize the nesting of your content. | ||
| 3 | Accessibility Inspector | Accessibility, Accessibility inspector, DevTools, Guide, Tools |
| The Accessibility Inspector provides a means to access important information exposed to assistive technologies on the current page via the accessibility tree, allowing you to check what's missing or otherwise needs attention. This article takes you through the main features of the Accessibility Inspector and how to use it. | ||
| 4 | Color vision simulation | Accessibility, Accessibility inspector, Color blindness, DevTools, Guide, Simulation, Tools |
| The simulator in the Accessibility Inspector in Firefox Developer Tools lets you see what a web page would look like to users with various forms of color vision deficiency (better known as "color blindness"), as well as contrast sensitivity loss. | ||
| 5 | Add-ons | Web Development, Web Development:Tools |
| Developer tools that are not built into Firefox, but ship as separate add-ons. | ||
| 6 | DOM Inspector | DOM, DOM:Tools, DOM_Inspector, Extensions, Extensions:Tools, Themes, Themes:Tools, Tools, Web Development, Web Development:Tools, XUL, XUL:Tools |
| The DOM Inspector (also known as DOMi) is a developer tool used to inspect, browse, and edit the Document Object Model of documents - usually web pages or XUL windows. The DOM hierarchy can be navigated using a two-paned window that allows a variety of different views on the document and all nodes within. | ||
| 7 | DOM Inspector FAQ | DOM_Inspector |
| The File menu contains approaches which will allow you to inspect a document. | ||
| 8 | DOM Inspector internals | Code, Tools, internals, organisation, source |
There are three main facets to DOM Inspector. The one you are likely to be most familiar with is its inspector.xul-based primary UI. This is the two-pane inspector that appears when Ctrl+Shift+I (or Cmd+Shift+I) is pressed from one of the applications for which DOM Inspector has explicit support (i.e., menuitems placed via overlay). |
||
| 9 | Introduction to DOM Inspector | DOM_Inspector |
| The DOM Inspector is a Mozilla extension that you can access from the Tools > Web Development menu in SeaMonkey, or by selecting the DOM Inspector menu item from the Tools menu in Firefox and Thunderbird, or by using Ctrl/Cmd+Shift+I in either application. DOM Inspector is standalone; it supports all toolkit applications, and it's possible to embed it in your own XULRunner app. DOM Inspector can serve as a sanity check to verify the state of the DOM, or it can be used to manipulate the DOM by hand, if desired. | ||
| 10 | All keyboard shortcuts | Tools, l10n:priority |
| This page lists all keyboard shortcuts used by the developer tools built into Firefox. | ||
| 11 | Application | Application, Debugging, DevTools, Firefox, Guide, Manifests, Service Workers |
| The Application panel provides tools for inspecting and debugging modern web apps (also known as Progressive Web Apps). This includes inspection of service workers and web app manifests. | ||
| 12 | Debugging service workers | Application, DevTools, Firefox, Guide, Service Workers |
| In this article we will look at debugging service workers using the Firefox DevTools Application Panel. | ||
| 13 | Inspecting web app manifests | Application, DevTools, Firefox, Guide, Manifest |
| In this article we will look at inspecting app manifests using the Firefox DevTools Application panel. | ||
| 14 | Browser Console | Browser, Debugging, Tools, Web Development, WebDevelopment:Tools |
| The Browser Console is like the Web Console, but applied to the whole browser rather than a single content tab. | ||
| 15 | Browser Toolbox | Debug, Firefox, JavaScript |
| The Browser Toolbox enables you to debug add-ons and the browser's own JavaScript code rather than just web pages like the normal Toolbox. The Browser Toolbox's context is the whole browser rather than just single page on a single tab. | ||
| 16 | DOM Property Viewer | DOM, Tools, Web Development |
The DOM Property Viewer lets you inspect the properties of the DOM as an expandable tree structure, starting from the window object of the current page or the selected iframe. |
||
| 17 | Debugger-API | Debugger, Intermediate, Intro, JavaScript, Tools |
Mozilla’s JavaScript engine, SpiderMonkey, provides a debugging interface named Debugger which lets JavaScript code observe and manipulate the execution of other JavaScript code. Both Firefox’s built-in developer tools and the Firebug add-on use Debugger to implement their JavaScript debuggers. However, Debugger is quite general, and can be used to implement other kinds of tools like tracers, coverage analysis, patch-and-continue, and so on. |
||
| 18 | Debugger | |
When called as a constructor, the Debugger object creates a new Debugger instance. |
||
| 19 | Debugger.Environment | |
A Debugger.Environment instance represents a lexical environment, associating names with variables. Each Debugger.Frame instance representing a debuggee frame has an associated environment object describing the variables in scope in that frame; and each Debugger.Object instance representing a debuggee function has an environment object representing the environment the function has closed over. |
||
| 20 | Debugger.Frame | |
A Debugger.Frame instance represents a visible stack frame. Given a Debugger.Frame instance, you can find the script the frame is executing, walk the stack to older frames, find the lexical environment in which the execution is taking place, and so on. |
||
| 21 | Debugger.Memory | |
The Debugger API can help tools observe the debuggee’s memory use in various ways: |
||
| 22 | Debugger.Object | |
A Debugger.Object instance represents an object in the debuggee, providing reflection-oriented methods to inspect and modify its referent. The referent’s properties do not appear directly as properties of the Debugger.Object instance; the debugger can access them only through methods like Debugger.Object.prototype.getOwnPropertyDescriptor and Debugger.Object.prototype.defineProperty, ensuring that the debugger will not inadvertently invoke the referent’s getters and setters. |
||
| 23 | Debugger.Script | |
A Debugger.Script instance may refer to a sequence of bytecode in the debuggee or to a block of WebAssembly code. For the former, it is the Debugger API’s presentation of a JSAPI JSScript object. The two cases are distinguished by their format property being "js" or "wasm". |
||
| 24 | Debugger.Source | |
A Debugger.Source instance represents either a piece of JavaScript source code or the serialized text of a block of WebAssembly code. The two cases are distinguished by the latter having its introductionType property always being "wasm" and the former having its introductionType property never being "wasm". |
||
| 25 | Tutorial: Set a breakpoint | |
This page shows how you can try out the Debugger API yourself using Firefox’s Scratchpad. We use Debugger to set a breakpoint in a function, and then evaluate an expression whenever it is hit. |
||
| 26 | Tutorial: Show Allocations Per Call Path | Debugger, Tools, Tutorial |
This page shows how to use the Debugger API to show how many objects a web page allocates, sorted by the function call path that allocated them. |
||
| 27 | Debugger.Object | |
A Debugger.Object instance represents an object in the debuggee, providing reflection-oriented methods to inspect and modify its referent. The referent's properties do not appear directly as properties of the Debugger.Object instance; the debugger can access them only through methods like Debugger.Object.prototype.getOwnPropertyDescriptor and Debugger.Object.prototype.defineProperty, ensuring that the debugger will not inadvertently invoke the referent's getters and setters. |
||
| 28 | Deprecated tools | Deprecated, Tools |
| Over the course of DevTools development, we have added several experimental panels to try out new ideas. Not all of these have had wide adoption, and due to the cost of maintenance, seldom used panels are eventually removed. | ||
| 29 | DevTools API | DevTools |
| The DevTools API provides a way to register and access developer tools in Firefox. | ||
| 30 | DevToolsColors | CSS |
| This chart lists colors and CSS variables as implemented in the dark theme and light theme for developer tools. | ||
| 31 | Eyedropper | Firefox, Tools, Web Development:Tools |
| The Eyedropper tool enables you to select colors in the current page. It works like a magnifying glass over the page, enabling you to select with pixel precision. Underneath the magnifying glass it shows the color value for the current pixel using whichever scheme you've selected in Settings > Inspector > Default color unit: | ||
| 34 | Index | Tools |
| Found 158 pages: | ||
| 35 | JSON viewer | |
| Firefox includes a JSON viewer. If you open a JSON file in the browser, or view a remote URL with the Content-Type set to application/json, it is parsed and given syntax highlighting. Arrays and objects are shown collapsed, and you can expand them using the "+" icons. | ||
| 36 | Measure a portion of the page | Design, DevTools, Developer, Firefox, Layout, Measure, Measuring, Measuring Tool, Tools |
| Using the Measuring Tool you can measure a specific area of a web page. | ||
| 37 | Memory | DevTools, Firefox, Mozilla, Tools |
| The Memory tool lets you take a snapshot of the current tab's memory heap. It then provides a number of views of the heap that can show you which objects account for memory usage and exactly where in your code you are allocating memory. | ||
| 38 | Aggregate view | |
| Before Firefox 48, this was the default view of a heap snapshot. After Firefox 48, the default view is the Tree map view, and you can switch to the Aggregate view using the dropdown labeled "View:": | ||
| 39 | Basic operations | |
| Before Firefox 50, the Memory tool is not enabled by default. To enable it, open the developer tool settings, and check the "Memory" box under "Default Firefox Developer Tools": | ||
| 40 | DOM allocation example | |
| This article describes a very simple web page that we'll use to illustrate some features of the Memory tool. | ||
| 41 | Dominators | |
| With a garbage-collected language, like JavaScript, the programmer doesn't generally have to worry about deallocating memory. They can just create and use objects, and when the objects are no longer needed, the runtime takes care of cleaning up, and frees the memory the objects occupied. | ||
| 42 | Dominators view | |
| Starting in Firefox 46, the Memory tool includes a new view called the Dominators view. This is useful for understanding the "retained size" of objects allocated by your site: that is, the size of the objects themselves plus the size of the objects that they keep alive through references. | ||
| 43 | Monster example | |
| This article describes a very simple web page that we'll use to illustrate some features of the Memory tool. | ||
| 44 | Tree map view | |
| The Tree map view provides a visual representation of the snapshot, that helps you quickly get an idea of which objects are using the most memory. | ||
| 45 | Migrating from Firebug | Firebug, Migration |
| When migrating from Firebug to the Firefox Developer Tools, you may wonder where the features you loved in Firebug are available in the Developer Tools. The following list aims to help Firebug users to find their way into the Developer Tools. | ||
| 46 | Network Monitor | Debugging, Dev Tools, Firefox, Guide, Networking, Tools, l10n:priority |
| The Network Monitor shows you all the network requests Firefox makes (for example, when it loads a page, or due to XMLHttpRequests), how long each request takes, and details of each request. | ||
| 47 | Inspecting web sockets | JavaScript, Network Monitor, WebAPIs, web socket inspector, web sockets |
| Since Firefox 71, the Network Monitor has had the ability to inspect web socket connections. This article explores what functionality the Web Socket Inspector makes available. | ||
| 48 | Network monitor recording | 110n:priority, Debugging, Dev Tools, Firefox, Guide, Networking, Tools |
| You can pause and resume the monitoring of network traffic using the pause button. | ||
| 49 | Network monitor toolbar | 110n:priority, Debugging, Dev Tools, Firefox, Guide, Networking, Tools |
| The network monitor provides two toolbar areas, one above the main section, and another below. | ||
| 50 | Network request details | 110n:priority, Debugging, Dev Tools, Firefox, Guide, Networking, Tools |
| The request details pane appears when you click on a network request in the request list. This pane provides more detailed information about the request. | ||
| 51 | Network request list | 110n:priority, Debugging, Dev Tools, Firefox, Guide, Networking, Tools |
| The request list of the Network Monitor shows a list of all the network requests made in the course of loading the page. | ||
| 52 | Performance Analysis | 110n:priority, Debugging, Dev Tools, Firefox, Guide, Networking, Tools |
| The Network Monitor includes a performance analysis tool, to help show you how long the browser takes to download the different parts of your site. | ||
| 53 | Throttling | 110n:priority, Debugging, Dev Tools, Firefox, Guide, Networking, Tools |
| The network monitor allows you to throttle your network speed to emulate various connection speeds so you can see how your app will behave under different connection types. | ||
| 54 | Page Inspector | CSS, DOM, HTML, Stylesheets, Web Development, Web Development:Tools, l10n:priority |
| Use the Page Inspector to examine and modify the HTML and CSS of a page. | ||
| 55 | How to | |
| Links for various HOW TO's can be found here. These links describe in depth the HOW TO techniques. | ||
| 56 | CSS Flexbox Inspector: Examine Flexbox layouts | Guide, Inspector, Tools, flexbox |
| The Flexbox Inspector allows you to examine CSS Flexbox Layouts using the Firefox DevTools, which is useful for discovering flex containers on a page, examining and modifying them, debugging layout issues, and more. | ||
| 57 | CSS Grid Inspector: Examine grid layouts | Guide, Inspector, Tools |
| The Grid Inspector allows you to examine CSS Grid Layouts using the Firefox DevTools, discovering grids present on a page, examining and modifying them, debugging layout issues, and more. | ||
| 58 | Edit CSS filters | CSS, DevTools, Filters, Page Inspector, Tools |
CSS filter properties in the Rules view have a circular gray and white swatch next to them: |
||
| 59 | Edit Shape Paths in CSS | CSS, DevTools, Page Inspector, Rules view, Tools, highlighter, shapes |
The Shape Path Editor is a tool that helps you see and edit shapes created using clip-path and also the CSS shape-outside property and <basic-shape> values. This guide walks you through all of the available options. |
||
| 60 | Edit fonts | Fonts, Guide, Inspector, Tools, variable fonts |
| This article provides a tour of the Font tools available in the Firefox DevTools. This tool contains several useful features for viewing and manipulating fonts applied to any document loaded in the browser including inspection of all fonts applied to the page, and precise adjustment of variable font axis values. | ||
| 61 | Examine Event Listeners | Guide, Inspector, Tools |
| The inspector shows the word "event" next to elements in the HTML Pane, that have event listeners bound to them: | ||
| 62 | Examine and edit CSS | Guide, Inspector, Tools |
| You can examine and edit CSS in the Inspector's CSS pane. | ||
| 63 | Examine and edit HTML | Debugging, Firefox, Guide, Inspector, Mozilla, Tools |
| You can examine and edit the page's HTML in the HTML pane. | ||
| 64 | Examine and edit the box model | Guide, Tools |
| With the Select Element button pressed, if you hover over an element in the page, the box model for the element is shown overlaid on the page: | ||
| 65 | Inspect and select colors | Guide, Inspector, Tools |
| In the CSS Pane's Rules view, if a rule contains a color value, you'll see a sample of the color next to the value: | ||
| 66 | Open the Inspector | Guide, Inspector, Tools |
| There are two main ways to open the Inspector: | ||
| 67 | Reposition elements in the page | |
| Starting in Firefox 48 you can move absolutely positioned elements by dragging them around the page. | ||
| 68 | Select an element | Guide, Inspector, Tools |
| The selected element is the element in the page that the Inspector is currently focused on. The selected element is shown in the HTML pane and its CSS is displayed in the CSS pane. | ||
| 69 | Select and highlight elements | |
| The selected element is the element in the page that the Inspector is currently focused on. The selected element is shown in the HTML pane and its CSS is displayed in the CSS pane. | ||
| 70 | Use the Inspector API | Inspector, Reference, Référence(2), Tools |
| Firefox add-ons may access the following objects from the chrome://browser/content/devtools/inspector/inspector.xul context: | ||
| 71 | Use the Inspector from the Web Console | Guide, Inspector, Tools |
The element that's currently selected in the Page Inspector can be referenced in the Web Console using the variable $0. |
||
| 72 | View background images | |
| In the Rules view, you can see a preview of images specified using background-image. Just hover over the rule: | ||
| 73 | Visualize transforms | Guide, Inspector, Tools |
If you hover over a transform property in the Rules view, you'll see the transformation overlaid in the page: |
||
| 74 | Work with animations | Guide, Inspector, Tools |
| This article covers three tools you can use to visualize and edit animations: | ||
| 75 | Animation inspector (Firefox 41 and 42) | |
| The Animation inspector enables you to: | ||
| 76 | Animation inspector example: CSS transitions | |
| Example animation using CSS transitions. | ||
| 77 | Animation inspector example: Web Animations API | |
| Example animation using the Web Animations API. | ||
| 78 | Page inspector 3-pane mode | 3-pane, CSS, Guide, Inspector, Tools |
| This article explains how to use the Page Inspector's 3-pane mode. | ||
| 79 | Page inspector keyboard shortcuts | |
| These shortcuts work while the node picker is active. | ||
| 80 | UI Tour | Guide, Inspector, Tools |
| This article is a quick tour of the main sections of the Page Inspector's user interface. | ||
| 81 | Paint Flashing Tool | Web Performance |
| The paint flashing tool, when activated, highlights the part of a page that the browser needs to repaint in response to some input: for example, the user moving the mouse or scrolling. With the help of this tool you can figure out whether your website is causing the browser to repaint more than it needs to. Because repaints can be performance-intensive operations, eliminating unnecessary repaints can improve your website's responsiveness. | ||
| 82 | Performance | Developer Tools, Learn, Performance, Web Performance |
| The Performance tool gives you insight into your site's general responsiveness, JavaScript and layout performance. With the Performance tool you create a recording, or profile, of your site over a period of time. The tool then shows you an overview of the things the browser was doing to render your site over the profile, and a graph of the frame rate over the profile. | ||
| 83 | Allocations | |
| To enable the Allocations view, you must check "Record Allocations" in the Performance tool settings, before recording a profile. Then record a profile as usual, and you will see a new tab labeled "Allocations" in the toolbar: | ||
| 84 | Call Tree | JavaScript, Performance, memory |
| The Call Tree is a sampling profiler. It periodically samples the state of the JavaScript engine and records the stack for the code executing at the time. Statistically, the number of samples taken in which we were executing a particular function corresponds to the amount of time the browser spent executing it. | ||
| 85 | Examples | |
| List of demo pages for performance scenarios and walkthroughs. | ||
| 86 | Sorting algorithms comparison | |
| This article describes a simple example program that we use in two of the Performance guides: the guide to the Call Tree and the guide to the Flame Chart. | ||
| 87 | Flame Chart | |
| The Call Tree and the Flame Chart are both used to analyze your site's JavaScript, and they both use the same data: a sample of the JavaScript engine's stack, taken periodically during the recording. | ||
| 88 | Frame rate | |
| Frame rate is the rate at which a video device can produce images (or frames). It's most familiar from film and gaming, but is now widely used as a performance measure for websites and web apps. | ||
| 89 | How to | |
| To open the Performance tools: | ||
| 90 | Scenarios | NeedsContent |
| Performance scenarios | ||
| 91 | Animating CSS properties | CSS animation, Developer Tools, Web Performance |
| With CSS animations you specify a number of keyframes, each of which uses CSS to define the appearance of the element at a particular stage of the animation. The browser creates the animation as a transition from each keyframe to the next. | ||
| 92 | Intensive JavaScript | |
| If you want to play along you can find the demo website here. | ||
| 93 | UI Tour | |
| The performance tool's UI consists of 4 main pieces: | ||
| 94 | Waterfall | |
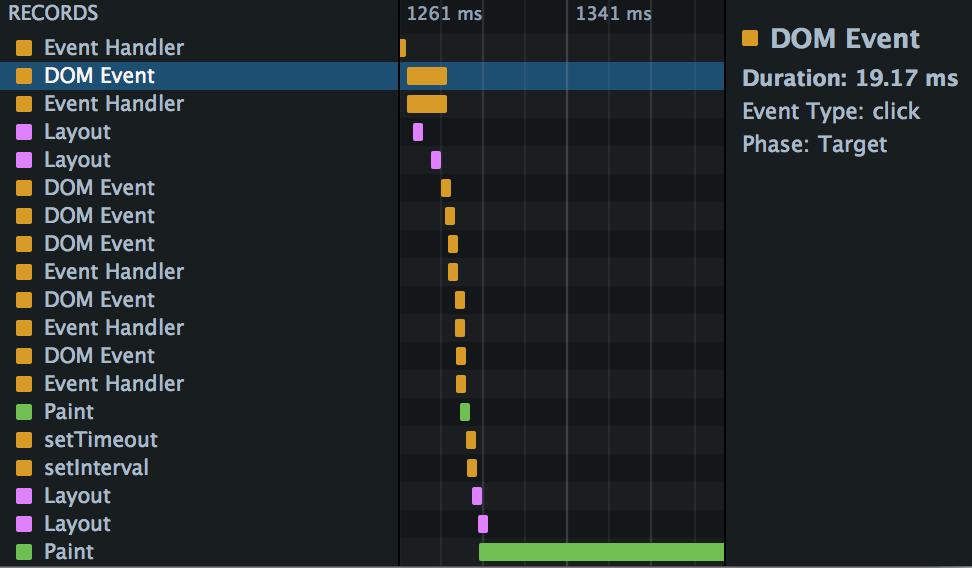 |
||
| 95 | Remote Debugging | Tools, l10n:priority |
| You can use the Firefox developer tools on your desktop to debug Web sites and Web apps running in other browsers or runtimes. The other browser might be on the same device as the tools themselves or on a different device, such as a phone connected over USB. | ||
| 96 | Debugging Firefox Desktop | Debugging, Guide, Tools |
| This guide explains how you can use the Firefox Developer Tools to debug a different instance of desktop Firefox running on the same machine. In this guide, the instance of Firefox being debugged is called the debuggee, and the instance of Firefox doing the debugging is called the debugger. | ||
| 101 | Responsive Design Mode | Design, Dev Tools, Firefox, Guide, Responsive Design, Tools, Web Development, l10n:priority |
| Responsive design is the practice of designing a website so it looks and works properly on a range of different devices — particularly mobile phones and tablets as well as desktops and laptops. | ||
| 102 | Rulers | DevTools, Firefox, Rulers, Tools |
| You can overlay horizontal and vertical rulers on a web page: | ||
| 103 | Settings | |
| Beginning with Firefox 62, the icon to open Developer Tools settings has been moved into a menu accessed by clicking/touching ... (the elipsis) on the right of the tab. | ||
| 104 | Shader Editor | |
| The Shader Editor enables you to see and edit the vertex and fragment shaders used by WebGL. | ||
| 105 | Storage Inspector | Cookies, Dev Tools, Firefox, Guide, IndexedDB, Local Storage, Session Storage, Storage, Tools |
| The Storage Inspector enables you to inspect various types of storage that a web page can use. Currently it can be used to inspect the following storage types: | ||
| 106 | Cache Storage | Cache Storage, DevTools, Firefox, Guide, Storage, Storage Inspector, Tools, l10n:priority |
| Under the Cache Storage type within the Storage Inspector you can see the contents of any DOM caches created using the Cache API. If you select a cache, you'll see a list of the resources it contains. For each resource, you'll see: | ||
| 107 | Cookies | Cookies, Dev Tools, Firefox, Guide, Storage, Storage Inspector, Tools, l10n:priority |
| When you select an origin inside the Cookies storage type from the storage tree, all the cookies present for that origin will be listed in a table. The cookies table has the following columns: | ||
| 108 | Extension Storage | Dev Tools, Extension Storage, Firefox, Guide, Storage, Storage Inspector, Tools, l10n:priority |
| This storage type is only shown when debugging extensions. When selecting an extension ID in the storage tree of the Storage Inspector, a table lists the details of all the extension storage present for the extension. This table contains the following columns: | ||
| 109 | IndexedDB | Dev Tools, Firefox, Guide, IndexedDB, Storage, Storage Inspector, Tools, l10n:priority |
| When you select an origin inside the Indexed DB storage type in the storage tree of the Storage Inspector, a table lists the details of all the databases present for that origin. | ||
| 110 | Local Storage / Session Storage | Dev Tools, Firefox, Guide, Local Storage, Session Storage, Storage, Storage Inspector, Tools, l10n:priority |
| When an origin corresponding to local storage or session storage is selected within the Storage Inspector, the names and values of all the items corresponding to local storage or session storage will be listed in a table. | ||
| 111 | Style Editor | CSS, Stylesheets, Tools, Web Development, Web Development:Tools |
| The Style Editor enables you to: | ||
| 112 | Taking screenshots | Screenshot, Tools |
| You can use the Developer Tools to take a screenshot of the entire page, or of a single element in the page. | ||
| 113 | The Firefox JavaScript Debugger | Debugger, Debugging, Dev Tools, JavaScript, Tools, l10n:priority |
| The JavaScript Debugger enables you to step through JavaScript code and examine or modify its state to help track down bugs. | ||
| 114 | Break on DOM mutation | DOM Mutation Breakpoint, Debugger, Debugging, Dev Tools, Tools, breakpoint |
| A DOM Mutation Breakpoint pauses the code when the DOM node on which you have set the breakpoint is modified. | ||
| 115 | Debug worker threads | Debugger, Service Workers, Web Workers, debug threads |
| The debugger shows the source code for all running worker threads — web workers, service workers, etc. — listed in the sources list. You can open the JavaScript file for the worker process and set breakpoints and logpoints just as you can with JavaScript code running on the main thread. | ||
| 116 | Debugger keyboard shortcuts | Debugger, keyboard, shortcuts |
| 1. By default, on some Macs, the function key is remapped to use a special feature: for example, to change the screen brightness or the volume. See this guide to using these keys as standard function keys. To use a remapped key as a standard function key, hold the Function key down as well (so to open the Profiler, use Shift + Function + F5). | ||
| 117 | How to | |
| These articles describe how to use the debugger. | ||
| 118 | Access debugging in add-ons | |
| The following items are accessible in the context of chrome://browser/content/debugger.xul (or, in version 23 beta, chrome://browser/content/devtools/debugger.xul): | ||
| 119 | Breaking on exceptions | |
| When an exception occurs, the line where it occurs is highlighted in the source pane, with a squiggly red line under the problematic code. A tooltip describes the exception. Starting in Firefox 80, a disclosure triangle within the tooltip reveals a stack trace. | ||
| 120 | Debug eval sources | |
You can debug JavaScript code that is evaluated dynamically, either as a string passed to eval() or as a string passed to the Function constructor. |
||
| 121 | Disable breakpoints | |
| To disable a single breakpoint, uncheck the checkbox next to it in the breakpoints list. | ||
| 122 | Examine, modify, and watch variables | |
| When the code has stopped at a breakpoint, you can examine its state in the variables pane of the debugger: | ||
| 123 | Highlight and inspect DOM nodes | DOM node, Debugger, DevTools, Page Inspector |
| If you hover over a DOM node in the Watch Expresions, it will be highlighted in the page. | ||
| 124 | Ignore a source | |
| In modern web development, we often rely on libraries like jQuery, Ember, or Angular, and 99% of the time we can safely assume that they “just work”. We don’t care about the internal implementation of these libraries. However, a library’s abstraction leaks during debugging sessions when you are forced to step through its stack frames in order to reach your own code. However, you can tell the debugger to ignore the details of selected sources. | ||
| 125 | Open the debugger | |
| There are three ways to open the debugger: | ||
| 126 | Pretty-print a minified file | JavaScript |
To prettify a minified file, click the Pretty print source icon ( ) at the bottom of the source pane. The debugger formats the source and displays it as a new file with a name like: "{ } [original-name]". ) at the bottom of the source pane. The debugger formats the source and displays it as a new file with a name like: "{ } [original-name]". |
||
| 127 | Search | |
| To search for a particular file, press Control + P (or Command + P on a Mac) and type the search term. The source pane will display a list of all matching files as you type. You can use the up and down arrows to move through the list, and Return to open the file you want: | ||
| 128 | Set a breakpoint | JavaScript, Tools, breakpoint, column breakpoint, conditional breakpoint |
| There are many different types of breakpoint that can be set in the debugger; this article covers standard (unconditional) breakpoints and conditional breakpoints. | ||
| 129 | Set a conditional breakpoint | Conditional, Debugger, Debugging, DevTools, Developer Tools, Firefox, Guide, JavaScript debugging, Tools, WM, breakpoint |
A normal breakpoint is just associated with a line: when the program reaches that line, the debugger pauses. A conditional breakpoint also has a condition associated with it, which is represented as an expression. When the program reaches the line, the debugger pauses only if the breakpoint's specified expression evaluates to true. |
||
| 130 | Set watch expressions | |
| When debugging code, sometimes it's useful to watch expressions as executions are paused. The Debugger features a pane for entering expressions to be watched (watch expressions). As you step through code, the debugger will watch the expression and return any results. | ||
| 131 | Step through code | Debugger, DevTools, JavaScript, Step through code |
| When the debugger is stopped at a breakpoint, you can step through it using four buttons in the toolbar: | ||
| 132 | Use a source map | |
| The JavaScript sources executed by the browser are often transformed in some way from the original sources created by a developer. For example: | ||
| 133 | Use watchpoints | Firefox, Guide, Tools |
| When debugging JavaScript code, it can be useful to know when properties on objects are read or modified. In a large, complex codebase, it's not always easy to know where in the code a given property is accessed. In the Firefox Debugger, this information can be provided by watchpoints. By setting a watchpoint on the property, rather than a breakpoint at a particular line, you can discover where that access occurs. | ||
| 134 | Set a logpoint | Debugger, Debugging, Dev Tools, JavaScript debugging, Tools, breakpoint, logpoint |
Sometimes you want to view a value in your code but you don't want to pause execution. Rather than sprinkle console.log() statements throughout your code, you can use a special type of breakpoint, the logpoint. Logpoints print a message to the Console panel instead of pausing code execution. |
||
| 135 | Set an XHR breakpoint | Debugger, Debugging, JavaScript, XHR Breakpoint |
| An XHR (XMLHttpRequest) breakpoint breaks code execution when an XHR request is dispatched so that you can examine the current state of the program. You can break on all requests or on those that include a specific URL. To turn on the feature: | ||
| 136 | Set event listener breakpoints | Debugger, Dev Tools, Event Debugging, Event Handler, Event Listener, JavaScript debugging, Tools, breakpoint, events |
| Starting with Firefox 69, debugging an application that includes event handlers is simplified because the debugger now includes the ability to automatically break when the code hits an event handler. This article explains how to use it. | ||
| 137 | Source map errors | Debugger, Debugging, Dev Tools, Reference, Source maps, Tools |
| Source maps are JSON files providing a way to associate transformed sources, as seen by the browser, with their original sources, as written by the developer. You can sometimes encounter problems working with source maps. This page explains the most common problems and how to fix them. | ||
| 138 | UI Tour | |
| This article is a quick tour of the main sections of the JavaScript Debugger's user interface. The UI is split vertically into three panels | ||
| 139 | Using the Debugger map scopes feature | |
| This feature is useful when debugging source-mapped code. It enables you to see the variables from the original source. It’s also possible to inspect variables from the generated scopes (e.g., a bundle file with all concatenated module files). | ||
| 140 | The Web Developer Menu | Add-ons, Debugging, Tools, Web Developer |
| The Web Developer menu is the main way to access the developer tools that are built into Firefox. On OS X and Linux, it's under the "Tools" menu: | ||
| 141 | Tips | Dev Tools, Tools, Web Development |
| Screenshots: | ||
| 142 | Toolbox | |
| The Toolbox provides a single home for most of the developer tools that are built into Firefox. | ||
| 143 | Validators | Tools, Website validator, html5 validator, validator |
| This document lists different resources for developers to validate web pages. | ||
| 144 | View Source | DevTools, Firefox, view page source |
| View Source lets you look at the HTML or XML source for the page you're viewing. To activate View Source: | ||
| 145 | Web Audio Editor | Firefox, Mozilla, Tools, Web Audio API |
With the Web Audio API, developers create an audio context. Within that context they then construct a number of audio nodes, including: |
||
| 146 | Web Console | Debugging, Guide, Security, Tools, Web Development, Web Development:Tools, l10n:priority, web console |
| The Web Console: | ||
| 147 | Console messages | |
| Most of the Web Console is occupied by the message display pane: | ||
| 148 | Invoke getters from autocomplete | |
| No summary! | ||
| 149 | Rich output | |
| When the Web console prints objects, it includes a richer set of information than just the object's name. In particular, it: | ||
| 150 | Split console | |
| You can use the console alongside other tools. While you're in another tool in the Toolbox, just press Esc or select the "Show split console" command in the Toolbar menu. The toolbox will now appear split, with the original tool above and the web console underneath. | ||
| 151 | The JavaScript input interpreter | Debugging, Web Development, web console |
| You can interpret JavaScript expressions in real time using the interpreter provided by the Web Console. It has two modes: single-line entry and multi-line entry. | ||
| 152 | Web Console Helpers | Debugging, JavaScript, Web Development, web console |
| The JavaScript command line provided by the Web Console offers a few built-in helper functions that make certain tasks easier. | ||
| 153 | Web Console UI Tour | Firefox, Tools, console, web console |
| No summary! | ||
| 154 | Web Console remoting | Debugging, Reference, Référence(2), web console |
| This document describes the way Web Console remoting works. The Web Console is split between a client with its user interface, and the server which has listeners for all the things that happen in the tab. For communication between the server and the client we use the Remote Debugging Protocol. This architecture allows you to connect a Web Console client instance to a server running on B2G, Fennec or some other Firefox instance. | ||
| 155 | Web console keyboard shortcuts | |
| These shortcuts apply when you're in the command line interpreter. | ||
| 156 | Working with iframes | Debugging, DevTools, Developer Tools, Frames, Tools |
You can point the developer tools at a specific iframe within a document. |
||
| 157 | about:debugging | Debugger, Remote debugging, about:debugging |
The about:debugging page provides a single place from which you can attach the Firefox Developer Tools to a number of debugging targets. At the moment it supports three main sorts of targets: restartless add-ons, tabs, and workers. |
||
| 158 | about:debugging (before Firefox 68) | |
| The about:debugging page provides a single place from which you can attach the Firefox Developer Tools to a number of debugging targets. At the moment it supports three main sorts of targets: restartless add-ons, tabs, and workers. | ||