
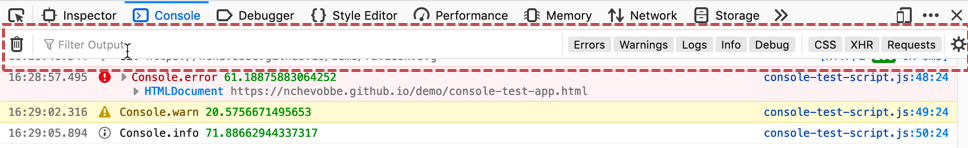
Most of the Web Console is occupied by the message display pane:
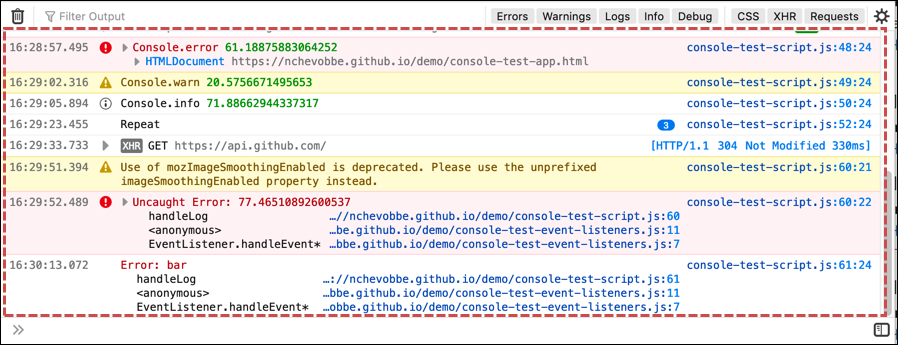
Each message is displayed as a separate row:
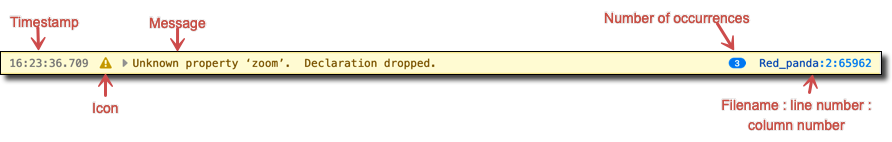
| Time | The time the message was recorded. This is not shown by default: you can opt to see timestamps by selecting Show Timestamps in the console settings menu (gear icon in the console toolbar). |
| Icon |
Not all console messages contain icons. The following icons may be used:
In addition, a disclosure triangle indicates that further information is available; clicking it displays or collapses that information. |
| Message | The message itself. |
| Number of occurrences | If a line that generates a warning or error is executed more than once, it is only logged once and this counter appears to indicate how many times it was encountered. |
| Filename and line number |
For JavaScript, CSS and console API messages, the message can be traced to a specific line of code. The console then provides a link to the filename and line number that generated the message. |
 Informational message
 Warning
 Error
Error Blocked; for network messages
By default, the console is cleared each time you navigate to a new page or reload the current page. To override this behavior, enable Persist Logs in the console settings menu (gear icon).
The context menu options listed below are available on all message categories. Additional context menu options are described in the subsection for the message category they apply to.
- Copy Message copies the selected message to the clipboard.
- Select All selects all messages available in the message display pane.
- Export Visible Messages To
- Clipboard copies all messages available in the display pane to the clipboard.
- File opens a file dialog box so you can save an export of all messages available in the display pane.
Message categories
Network
Network log messages are not shown by default. Use the filtering feature to show them.
Network requests are logged with a line that looks like this:
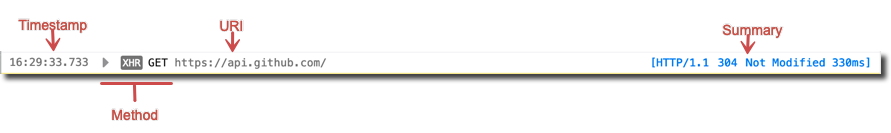
| Time | The time the message was recorded. |
| Method |
The specific HTTP request method. If the request was made as an XMLHttpRequest, there's an additional "XHR" tag indicating this. If more information is available, a disclosure triangle lets you display it, in an embedded panel that is identical to the Network Monitor request details. |
| URI | The target URI. |
| Summary | The HTTP version, response code, and time taken to complete. Clicking the response code takes you to the reference page for that code. |
The context menu for network messages includes a few extra items in addition the globally-available ones:
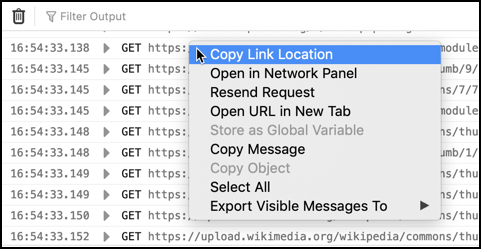
- Copy link location
- Acts as you would expect, copying the URL into the clipboard
- Open in Network Panel
- Switches context to the Network tab, selects the request and shows you the details
- Resend Request
- Sends the network request again.
- Open URL in New Tab
- Opens the URL in a new browser tab. If the resource is an image, the image will be opened in a new tab. If the resource is a stylesheet, you will see the CSS rules, etc.
JS
JavaScript errors contain a "Learn more" link that takes you to the JavaScript error reference containing additional advice for fixing issues:
Source maps
The Web Console understands source maps. This means that if your JavaScript sources are compressed, you can supply a source map for them. Then any messages or errors your source generates will show up in the Web Console with a link back to the original source, not the compressed version.
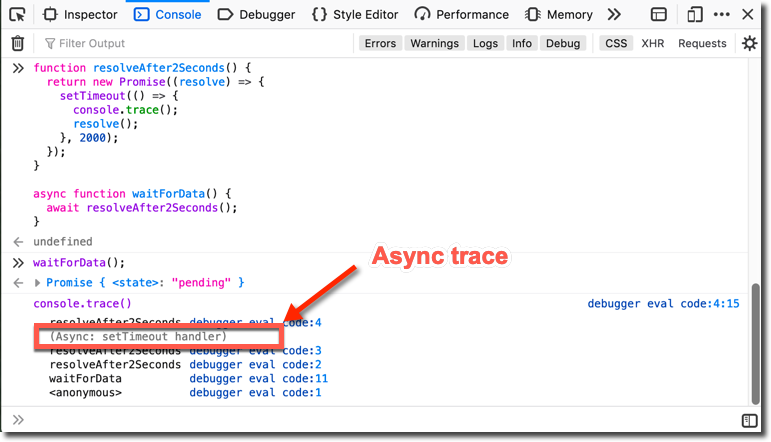
Async stack frames
Stack traces show stack frames for async functions separately from those for synchronous functions. When you run code containing an async function, its traces (console.trace or thrown error) are shown with an Async: prefix.
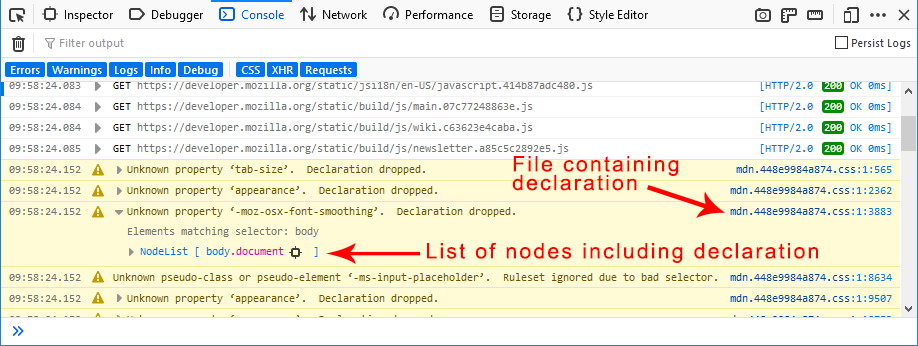
CSS
Note: CSS warnings and reflow messages are not shown by default, for performance reasons (see bug 1452143). Use the filtering feature to show them.
Some CSS messages contain a disclosure triangle at the left of the message. Click it to view more information about the error, as well as which DOM nodes are affected by the error.
Reflow events
The Web Console also logs reflow events under the CSS category. A reflow is the name given to the operation in which the browser calculates the layout of all or part of the page. Reflows occur when a change has happened to a page that the browser thinks affects the layout. Many events can trigger reflows, including: resizing the browser window, activating pseudoclasses like :hover, or manipulating the DOM in JavaScript.
Because reflows can be computationally expensive and directly affect the user interface, they can have a big impact on the responsiveness of a website or web app. By logging reflow events the Web Console can give you insight into when reflow events are being triggered, how long they take to execute and, if the reflows are synchronous reflows triggered from JavaScript, which code triggered them.
Reflow events are logged as "Reflow" messages, as distinct from CSS errors or warnings. By default, they are disabled. You can enable them by clicking the "CSS" button in the toolbar and selecting "Reflows".
Each message is labeled "reflow" and shows the time taken to execute the reflow.
If the reflow is a synchronous reflow triggered from JavaScript, it also shows a link to the line of code that triggered the reflow. Click the link to open the file in the Debugger.
Synchronous and asynchronous reflows
If a change is made that invalidates the current layout — for example, the browser window is resized or some JavaScript modifies an element's CSS — the layout is not recalculated immediately. Instead, the reflow happens asynchronously, the next time the browser decides it needs to be done (generally, the next time the browser repaints). In this way the browser can save up a collection of invalidating changes and recalculate their effect at once.
However, if some JavaScript code reads a style that has been modified, then the browser must perform a synchronous reflow in order to calculate the computed style to return. For example, code like this will cause an immediate, synchronous, reflow, when it calls window.getComputedStyle(thing).height:
var thing = document.getElementById("the-thing");
thing.style.display = "inline-block";
var thingHeight = window.getComputedStyle(thing).height;
Because of this, it's a good idea to avoid interleaving write and read calls to an element's styles when manipulating the DOM, because every time you read back a style that has been invalidated by a previous write call, you force a synchronous reflow.
Security
The security messages shown in the Web Console help developers find potential or actual vulnerabilities in their sites. Additionally, many of these messages help educate developers because they end with a “Learn More” link that takes you to a page with background information and advice for mitigating the issue.
The complete list of security messages is as follows:
| Message | Details |
|---|---|
| Blocked loading mixed active content | The page contained mixed active content: that is, the main page was served over HTTPS, but asked the browser to load "active content", such as scripts, over HTTP. The browser blocked this active content. See Mixed Content for more details. |
| Blocked loading mixed display content | The page contained mixed display content: that is, the main page was served over HTTPS, but asked the browser to load "display content", such as images, over HTTP. The browser blocked this display content. See Mixed Content for more details. |
| Loading mixed (insecure) active content on a secure page | The page contained mixed active content: that is, the main page was served over HTTPS, but asked the browser to load "active content", such as scripts, over HTTP. The browser loaded this active content. See Mixed Content for more details. |
| Loading mixed (insecure) display content on a secure page | The page contained mixed display content: that is, the main page was served over HTTPS, but asked the browser to load "display content", such as images, over HTTP. The browser loaded this display content. See Mixed Content for more details. |
| This site specified both an X-Content-Security-Policy/Report-Only header and a Content-Security-Policy/Report-Only header. The X-Content-Security-Policy/Report-Only header(s) will be ignored. | See Content Security Policy for more details. |
| The X-Content-Security-Policy and X-Content-Security-Report-Only headers will be deprecated in the future. Please use the Content-Security-Policy and Content-Security-Report-Only headers with CSP spec compliant syntax instead. | See Content Security Policy for more details. |
| Password fields present on an insecure (http://) page. This is a security risk that allows user login credentials to be stolen. | Pages containing login forms must be served over HTTPS, not HTTP. |
| Password fields present in a form with an insecure (http://) form action. This is a security risk that allows user login credentials to be stolen. | Forms containing password fields must submit them over HTTPS, not HTTP. |
| Password fields present on an insecure (http://) iframe. This is a security risk that allows user login credentials to be stolen. | iframes containing login forms must be served over HTTPS, not HTTP. |
| The site specified an invalid Strict-Transport-Security header. | See HTTP Strict Transport Security for more details. |
|
This site makes use of a SHA-1 Certificate; it's recommended you use certificates with signature algorithms that use hash functions stronger than SHA-1. |
The site uses a certificate whose signature uses the SHA-1 hash algorithm. SHA-1 is still still widely used in certificates, but it is starting to show its age. Web sites and Certification Authorities are encouraged to switch to stronger hash algorithms in future. See the Weak Signature Algorithm article for more details. Note that the SHA-1 certificate may not be your site's own certificate, but may be the certificate belonging to a Certification Authority that was used to sign your site's certificate. |
Bug 863874 is the meta-bug for logging relevant security messages to the Web Console. If you have more ideas for useful features like the ones discussed here, or are interested in contributing, check out the metabug and its dependencies.
Logging
Messages logged from Shared Workers, Service Workers, add-ons, and Chrome Workers are not shown by default. Use the filtering feature to show them.
The Logging category includes messages logged using the Console API.
The Web console supports the following Console API messages:
assert()clear()count()dir()dirxml()error()exception()group()groupEnd()info()log()table()time()timeEnd()trace()warn()
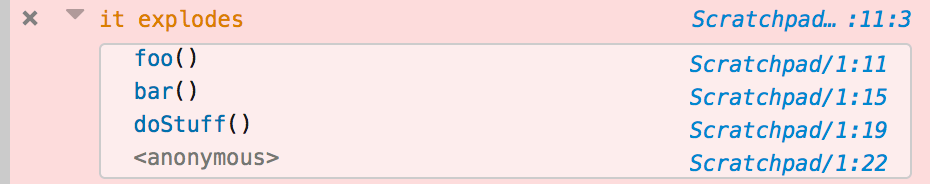
The console prints a stack trace for all error messages, like this:
function foo() {
  console.error("it explodes");
}

function bar() {
  foo();
}

function doStuff() {
 bar();
}

doStuff();
Server
Server-side log messages was introduced in Firefox 43, but removed in Firefox 56. You can install the Chrome Logger extension to (re)-enable the feature.
With the Chrome Logger extension, Web Console can display messages sent from the server. This enables you to use the Web Console to debug server-side code.
It uses the Chrome Logger protocol. Briefly, the way it works is:
- Your server-side code — Python, PHP, Node.js, etc. — includes a library that provides a console API.
- Your server-side code uses this API to log messages.
- The server-side library creates JSON objects from the messages and encodes them for transmission.
- The messages are transmitted to the client as a response header named
X-ChromeLogger-Data. - The Web Console decodes these headers and displays them.
To find a suitable library for your server code, see the Chrome Logger documentation.
Interpreter input/output
Commands sent to the browser using the Web Console's JavaScript interpreter, and the corresponding responses, are logged in the console messages.
For responses that contain objects or variables, the following context menu options are available:
- Reveal in Inspector
- Shows the selected DOM node in the Inspector pane.
- Store as Global Variable
- Creates a global variable (with a name like
temp0,temp1, etc.) whose value is the selected object. The name of the variable appears as an input to the interpreter, and its value appears as a response. - Copy Object
- Copies the selected object to the clipboard.
Filtering and searching
Filtering by category
You can use the toolbar along the top to constrain the results displayed.
 To see only messages of particular categories, click the button labeled with that category (Errors, CSS, and so on).
For Errors and Warnings, when you turn off display of the category, a number appears next to the button text to indicate how many messages of that type are available. For example, "Warnings (25)".
Network requests with response codes in the 400-499 (client error) or 500-599 (server error) ranges are considered errors. Their display is controlled by the Errors button, not the Requests button.
Filtering by text
To see only messages that contain a specific string, type in the text box labeled "Filter output". For example, if you entered the string img into the text box, you would have a list something like this:
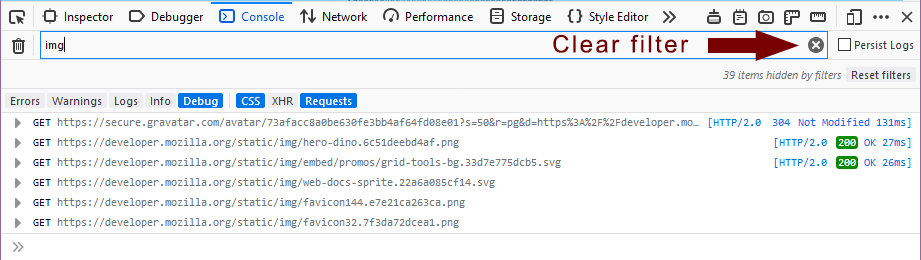
A small "x" icon appears at the right end of the text box when you have entered a string on which to filter the output. Click the "x" icon to clear the filter and show the entire list again.
You can negate a text search by prefixing it with the - character. For example, -img shows only items that do not contain the string img.
Filtering with Regular Expressions
You can also use a valid regular expression to filter the console output. For example, the following video shows the results when filtering on two simple regular expressions: /(cool|rad)/ and /(cool)/.
You can negate a regular expression search by prefixing it with the - character. For example, -/(cool|rad)/ shows only items that do not match the expression /(cool|rad)/.
Clearing the log
Finally, you can use the trashcan icon on the left to clear the contents of the console. When you clear the console, the console cache is also cleared. This prevents errors that have already been loged from reappearing when you reopen the console.