
In our table assessment, we provide you with some data on the planets in our solar system, and get you to structure it into an HTML table.
| Prerequisites: | Before attempting this assessment you should have already worked through all the articles in this module. |
|---|---|
| Objective: | To test comprehension of HTML tables and associated features. |
Starting point
To start the assessment, make local copies of blank-template.html, minimal-table.css, and planets-data.txt in a new directory in your local computer.
If you get stuck, then ask us for help — see the Assessment or further help section at the bottom of this page.
Note: Alternatively, you could use a site like JSBin or Glitch to do your assessment. You could paste the HTML, CSS and JavaScript into one of these online editors. If the online editor you are using doesn't have separate JavaScript/CSS panels, feel free to put them inline <script>/<style> elements inside the HTML page.
Project brief
You are working at a school; currently your students are studying the planets of our solar system, and you want to provide them with an easy-to-follow set of data to look up facts and figures about the planets. An HTML data table would be ideal — you need to take the raw data you have available and turn it into a table, following the steps below.
The finished table should look like this:
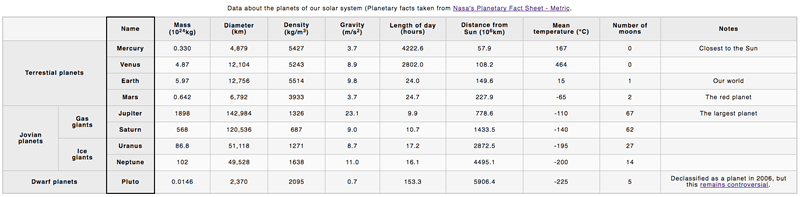
You can also see the example live here (no looking at the source code — don't cheat!)
Steps to complete
The following steps describe what you need to do to complete the table example. All the data you'll need is contained in the planets-data.txt file. If you have trouble visualising the data, look at the live example above, or try drawing a diagram.
- Open your copy of
blank-template.html, and start the table off by giving it an outer container, a table header, and a table body. You don't need a table footer for this example. - Add the provided caption to your table.
- Add a row to the table header containing all the column headers.
- Create all the content rows inside the table body, remembering to make all the row headings into headings semantically.
- Ensure all the content is placed into the right cells — in the raw data, each row of planet data is shown next to its associated planet.
- Add attributes to make the row and column headers unambiguously associated with the rows, columns, or rowgroups that they act as headings for.
- Add a black border just around the column that contains all the planet name row headers.
Hints and tips
- The first cell of the header row needs to be blank, and span two columns.
- The group row headings (e.g. Jovian planets) that sit to the left of the planet name row headings (e.g. Saturn) are a little tricky to sort out — you need to make sure each one spans the correct number of rows and columns.
- One way of associating headers with their rows/columns is a lot easier than the other way.
Assessment or further help
If you would like your work assessed, or are stuck and want to ask for help:
- Put your work into an online shareable editor such as CodePen, jsFiddle, or Glitch.
- Write a post asking for assessment and/or help at the MDN Discourse forum Learning category. Your post should include:
- A descriptive title such as "Assessment wanted for Structuring planet data".
- Details of what you have already tried, and what you would like us to do, e.g. if you are stuck and need help, or want an assessment.
- A link to the example you want assessed or need help with, in an online shareable editor (as mentioned in step 1 above). This is a good practice to get into — it's very hard to help someone with a coding problem if you can't see their code.
- A link to the actual task or assessment page, so we can find the question you want help with.